Here is the first support for ETH in case of a short-term correction (Ethereum price analysis)
Ethereum’s uptrend was halted after it hit the main resistance at $1.7K. Price action appears to be inconsistent while many expect a short-term correction. Technical Analysis By Shayan The daily chart Ethereum has crossed the 200-day moving average and the upper trend line of the multi-month channel due to the recent bullish move of the entire market. However, the price fell from the main resistance level of $1.7K and is now consolidating below it. On the other hand, there is a significant bearish divergence between the price and the RSI indicator on the daily time frame. This could lead to volatility in the coming days. Nonetheless, there are three on the daily chart…

Here is the first support for ETH in case of a short-term correction (Ethereum price analysis)
Ethereum’s uptrend was halted after it hit the main resistance at $1.7K. Price action appears to be inconsistent while many expect a short-term correction.
Technical analysis
From Shayan
The daily chart
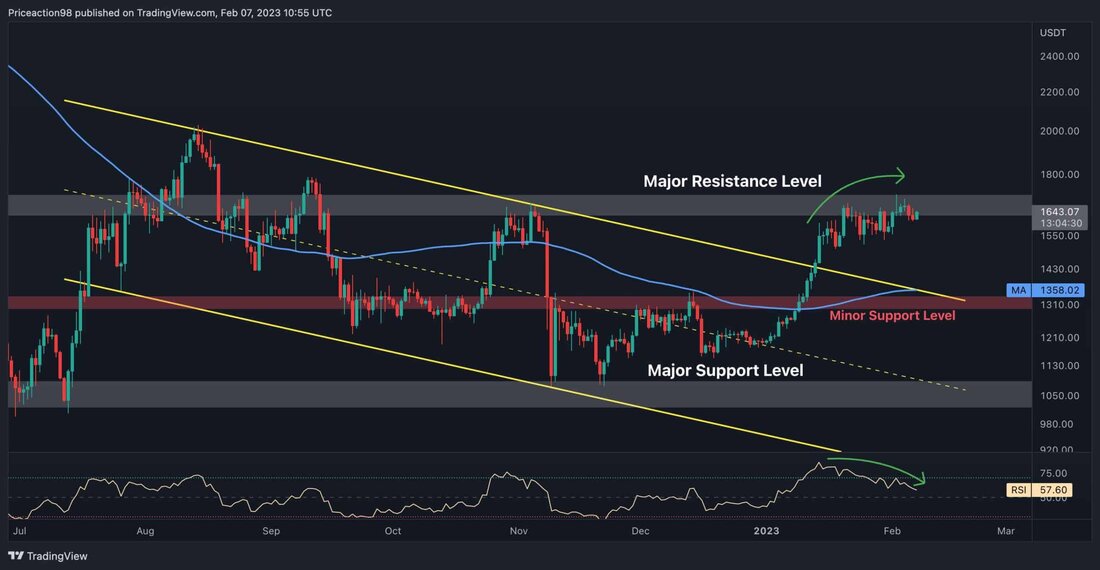
Ethereum has crossed the 200-day moving average and the upper trendline of the multi-month channel due to the recent bullish move across the market. However, the price fell from the main resistance level of $1.7K and is now consolidating below it.
On the other hand, there is a significant bearish divergence between the price and the RSI indicator on the daily time frame. This could lead to volatility in the coming days.
Nonetheless, there are three critical static levels for Ethereum on the daily chart; the major resistance level at $1.7K, the minor support level at $1.3K and the major support level at $1K.
The price has been hovering between $1k and $1.7k for several months, and the minor support level of $1.3k will likely be Ethereum's next stop in case it is rejected from $1.7k.
TradingView
The 4 hour chart
Ethereum price action appears to be bearish on the 4-hour timeframe as it has formed an ascending head and shoulders pattern, also known as the three-drive pattern, a popular reversal pattern in classic price action, after reaching a key resistance region.
If the cryptocurrency breaks below the neckline, around $1.5K, the market should expect a short-term dip towards the minor support level at $1.3K. Therefore, given the current price action and the bearish signs mentioned above, Ethereum is likely to experience a period of consolidation correction before the next impulsive move.
TradingView
On-chain analysis
From Shayan
The chart below shows the 14-day RSI of the Open Interest metric alongside the price of Ethereum. Following the recent uptrend in Bitcoin price over the last two weeks, ETH has also seen a rise, showing signs of demand in the market.
As a result, futures market activity has also increased over the past week, resulting in an upward trend in Ethereum open interest. When the RSI of open interest reaches the red zone (above 70), the possibility of a short-term correction usually expands.
CryptoQuant
Currently, the metric has risen sharply and is about to enter the red zone. Accordingly, a short-term dip could wash out highly leveraged long positions. This structure highlights the short-term risk of the futures market.
.

 Suche
Suche
 Mein Konto
