ETH enters the 7-day consolidation, but is there a big step before? (Ethereum price analysis)
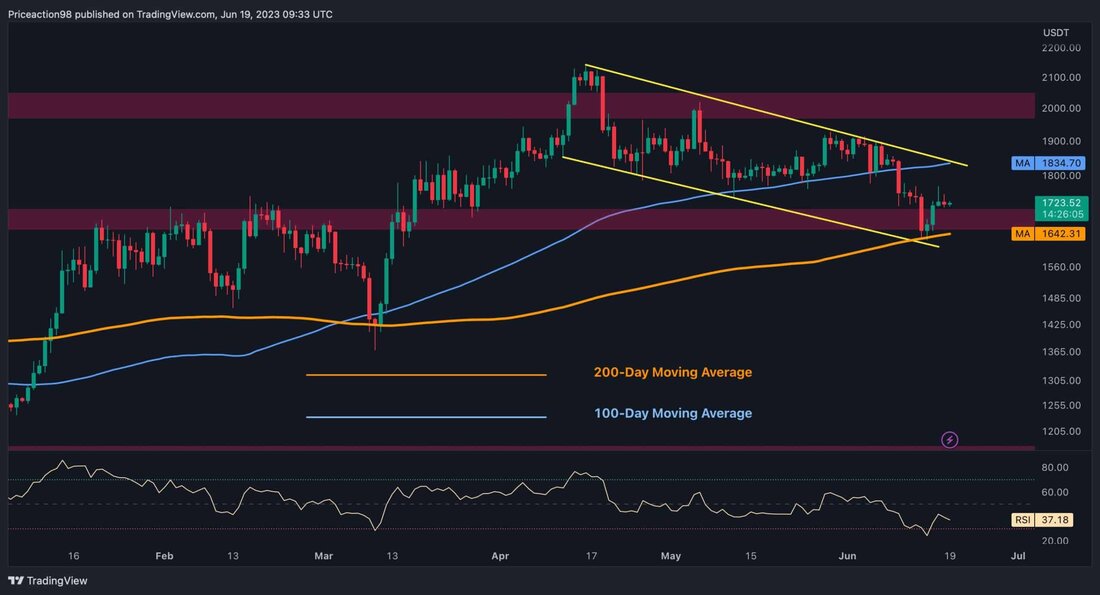
After a correction phase, the price of Ethereum found support in an important area, which included the sliding 200-day average and the lower trend line of the flag pattern at $ 1.6,000. As a result, the price initiated a slight upward rally. Shayan The daily chart after a long downward phase, the price reached a remarkable support area, which included the sliding 200-day average and the lower limit of the flag pattern. This area serves as robust support, since it also matches the static level of $ 1.6,000, which indicates considerable purchase pressure. As a result, this pressure to buy led to the development of an upward rally. However, the positive dynamics weakened when they ...

ETH enters the 7-day consolidation, but is there a big step before? (Ethereum price analysis)
After a correction phase, the price of Ethereum found support in an important area, which included the sliding 200-day average and the lower trend line of the flag pattern at $ 1.6,000. As a result, the price initiated a slight upward rally.
from Shayan
The daily chart
After a longer downward phase, the price reached a remarkable support area, which included the sliding 200-day average and the lower limit of the flag pattern. This area serves as robust support, since it also matches the static level of $ 1.6,000, which indicates considerable purchase pressure.
As a result, this pressure to buy led to the development of an upward rally. However, the positive dynamics weakened when it reached the previous little swing on the daily chart, which led to a lower volatility and development of very small candles.
If the upward rally continues, the next goal of Ethereum will be the sliding 100-day average and the upper trend line of the flag pattern, which is $ 1,834
Tradingview
The 4-hour diagram
On the 4-hour chart, the sales pressure remained high after the breakthrough under the lower trend line of the extended rising channel, which led to a further drop in prices.
Nevertheless, after a few days with red candles, ETH achieved the decisive fibonacci level of 61.8 %, which was the original goal for the correction legs during the upward rally, which went out of $ 1,368 until it met with $ 2.1,000 to considerable resistance. However, it should be noted that the latest upswing could be a relapse towards the opened level. Ultimately, the next step by Ethereum is determined by the future price development. Tradingview
on-chain analysis
from Shayan
The following diagram illustrates the relationship between the Exchange Netflow metric by Ethereum and its price. After the price of Ethereum came across a resistance at $ 2.1,000, it entered a longer consolidation correction phase, which led to a correction by 24 %. As shown in the graphic, the Netflow metric showed a downward trend during this market situation and finally fell under 0.
However, the latest complaint between Binance, Coinbase and the SEC as a catalyst for the downward trend on the market and prompted the participants to deduct their assets from these stock exchanges. As a result, the Netflow metric experienced another impulsive decline, which indicates the prevailing fear in the market.
Nevertheless, it is important to note that a robust and sustainable upward rally is not to be expected until the fears and uncertainties disappear from the market and returns sufficient demand.
Tradingview
.

 Suche
Suche
