Will Bitcoin fall below $ 30,000 or do the bulls experience a relaxation? (BTC price analysis)
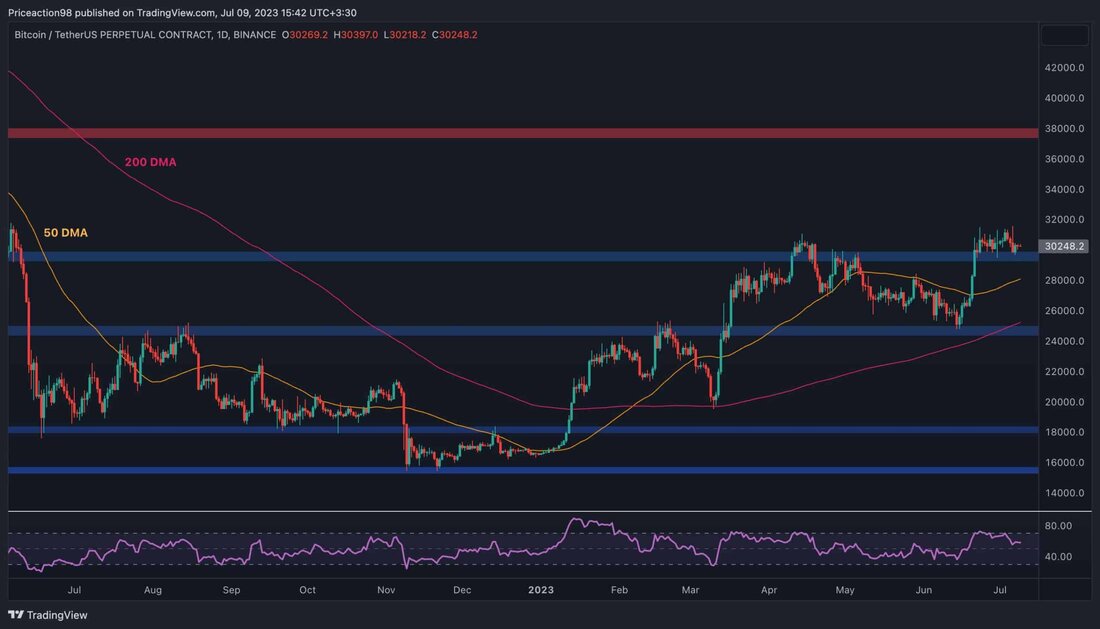
After the recent increase in the Bitcoin Prize and the successful outbreak over the significant resistance brand of $ 30,000, the market is now in a consolidation phase. However, remarkable signals are emerging in this phase. Technical analysis by: Edris The daily chart: On the daily chart, the price has repeatedly tested the $ 30,000 brand since its recent breakthrough. Although this level previously offered support, there are worrying signs in the form of a declining divergence with the RSI indicator. This indicates the possibility of a short -term correction or reversal. If there is a decline, the sliding 50-day and 200-day average could be around $ 28,000 ...

Will Bitcoin fall below $ 30,000 or do the bulls experience a relaxation? (BTC price analysis)
After the recent increase in the Bitcoin Prize and the successful outbreak about the significant resistance brand of $ 30,000, the market is now in a phase of consolidation. However, remarkable signals are emerging in this phase.
technical analysis
by: edris
The daily chart:
on the daily chart, the price has repeatedly tested the $ 30,000 mark since its recent breakthrough. Although this level has previously offered support, there are worrying signs in the form of a declining divergence with the RSI indicator.
This indicates the possibility of a short -term correction or reversal. If there is a decline, the sliding 50-day and 200-day average could serve as important level of support at around $ 28,000 or $ 26,000
If the price continues its upward trend, a movement in the direction of the resistance zone of $ 38,000 becomes a plausible scenario.
Tradingview
The 4-hour diagram:
On the 4-hour chart, the price has shown irregular and unpredictable movements in the past few weeks, which made it difficult to determine its future direction. The $ 30,000 mark is tested again and a possible collapse could lead to a decline in the direction of the $ 27,500 mark.
The RSI indicator was relatively flat and moved around 50 %brand, which indicates a lack of clear dominance of buyers or sellers. The continued fight near the critical $ 30,000 area increases short-term uncertainty on the market.
Tradingview
on-chain analysis
by: edris
Bitcoin stock exchange reserve
The recent increase in the Bitcoin Prize has triggered discussions about whether market participants sell their coins with minimal profits or decide to keep them longer.
By analyzing the Bitcoin stock exchange reserve meters, which follows the amount of BTC that is kept in stock exchange walls, we can gain insight into investor behavior. An increase in this key figure indicates that investors deposit their coins on stock exchanges probably with the intention of selling them. Conversely, a decline indicates that investors remove their BTC from the stock exchanges, which indicates that they prefer to keep their coins over a longer period of time.
Current data show a significant decline in Bitcoin stock exchange reserves in the past month. This decline indicates an optimistic mood among the market participants, as they expect further price increases and tend to stick to their coins.
Cryptoquant

 Suche
Suche
 Mein Konto
