After the latest correction of Bitcoin, this is the decisive level that it has to hold (price analysis)
Bitcoin's price has trouble breaking through a significant level of resistance and is currently experiencing a withdrawal after the last red days on Wall Street. Is it just a short -term correction or the beginning of a new declining phase? Technical analysis by: EDRIS The Tartar in the day of the day was the price shortly after it was rejected by the critical $ 25,000 mark. The sliding 50-day average by the level of $ 22,000 would be the first likely level of support, followed by the moving 200-day average by the psychological support range of $ 20,000. If these dynamic support levels do not hold, a further decline in the direction of the $ 18,000 mark is immediately ...

After the latest correction of Bitcoin, this is the decisive level that it has to hold (price analysis)
The price of Bitcoin has trouble breaking through a significant level of resistance and is currently experiencing a withdrawal after the last red days on Wall Street. Is it just a short -term correction or the beginning of a new declining phase?
technical analysis
from: Edris
the daily -type
In the day of the day, the price fell shortly after it was rejected by the critical $ 25,000 mark. The sliding 50-day average by the level of $ 22,000 would be the first likely level of support, followed by the sliding 200-day average by the psychological support range of $ 20,000.
If these dynamic support levels do not hold, a further decline in the direction of the $ 18,000 mark would be imminent. However, if the price recover from one of these levels, another renewed test and a potential outbreak via the resistance zone of $ 25,000 would be very likely.
The RSI indicator, who has signaled the recent rejection with a clear declining divergence, tends around the 50 %threshold, which indicates the momentum balance in the day.
The 4-hour diagram
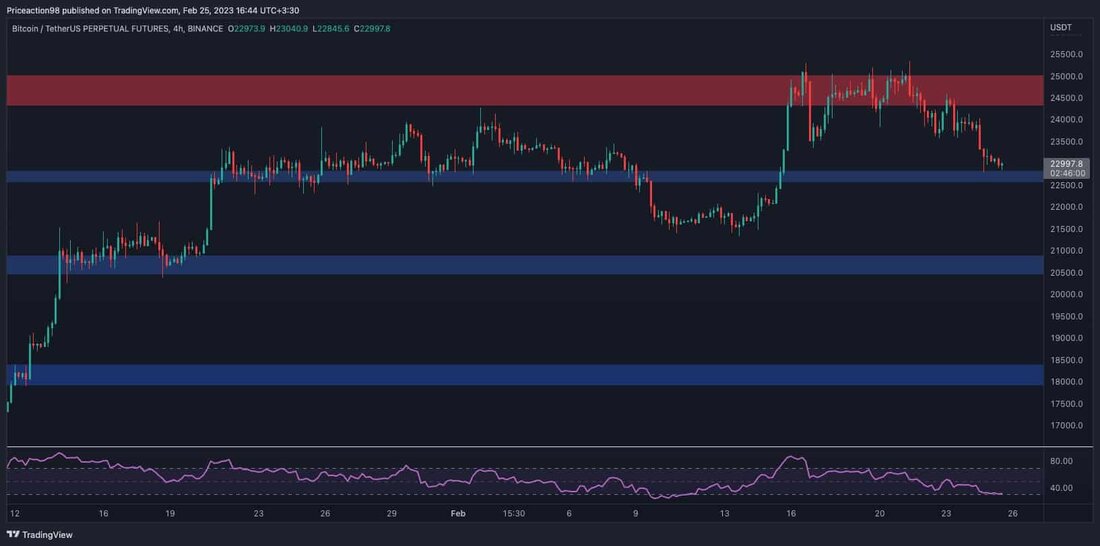
When analyzing the 4-hour charts, the price has dropped after several rejections from the $ 25,000 area and moves to the level of support of $ 22,500. A collapse of this level would possibly lead to a lower decline in the direction of $ 20,000- and even the $ 18,000 mark.
On the other hand, the RSI approaches in this period of the oversized zone, which could lead to a temporary recovery from the $ 22,500 mark, which could lead to a breakthrough over the $ 25,000 mark.For an outbreak over the $ 25,000 mark, further interest bullies would follow in the coming weeks, and from a technical point of view the bear market could finally be considered to be over.
an-chain analysis
Bitcoin miner reserve
The price of Bitcoin has increased lately and the market mood is becoming more positive. However, the miners, an important cohort on the Bitcoin market, have not yet shown any bullish behavior.
The following diagram shows the miner reserve metric, which measures the amount of BTC in the wallets of the miners. This key figure has decreased in recent months. Some miners finally surrender that others sell their BTC to provide liquidity and cover the operating costs.
If this trend continues, the sales pressure could flood the market with an oversupply and lead to a further drop in prices.
.

 Suche
Suche
 Mein Konto
