Ethereum faces a bearish break: Course fall to up to $ 1,105?
Ethereum forecast for March 13, 2025: Bärischer outbreak in the ETH course In the past four months, the Ethereum course (ETH) has fallen by over 57 %, which raises the question of how far the course could decrease. The technical analysis indicates that Ethereum may face a significant correction. Does the Ethereum course fall back to around USD 1,105? The current price trend by Ethereum shows significant bear -bearing signals. The MacD lines in the Monthly Charge crossed the bear, while the histogram of the MacDs ticks more deeply. The relative strength index (RSI) is in a neutral position. Ethereum is also about to ...

<p> <strong> Ethereum faces a bearish break: Course fall to up to $ 1,105? </strong> </p>
Ethereum forecast for March 13, 2025: Bärischer outbreak in the ETH course
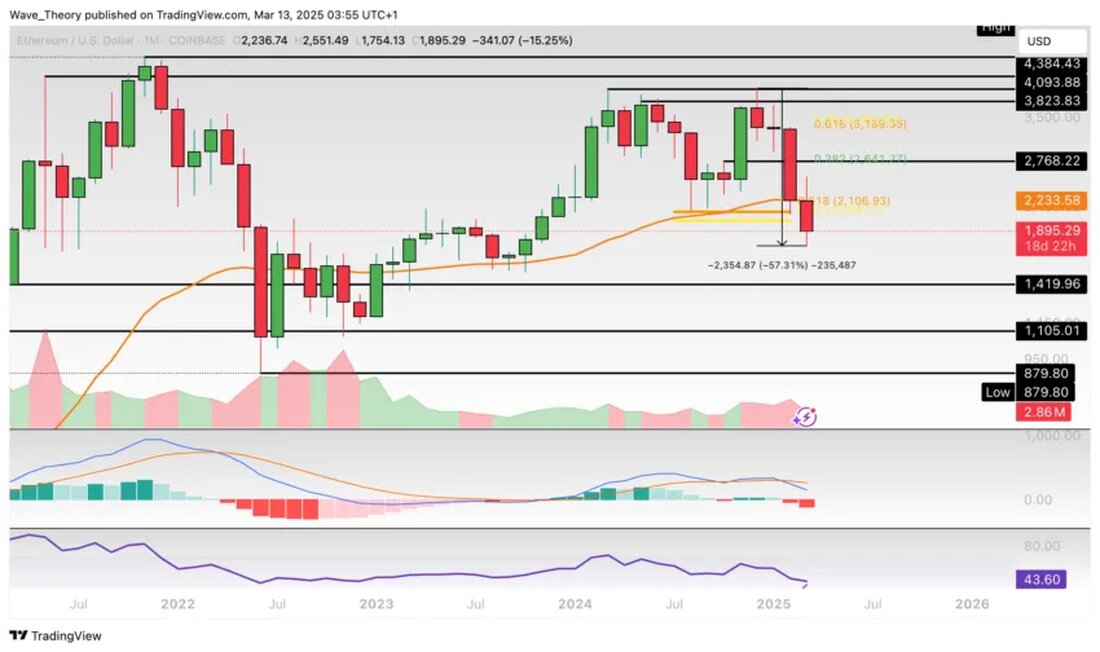
In the past four months, the Ethereum course (ETH) has fallen by over 57 %, which raises the question of how far the course could decrease. The technical analysis suggests that Ethereum may face a significant correction.
The Ethereum course falls back to around USD 1,105?
The current price trend by Ethereum shows significant bear signals. The MacD lines in the Monthly Charge crossed the bear, while the histogram of the MacDs ticks more deeply. The relative strength index (RSI) is in a neutral position. Ethereum is also about to break the Golden Ratio support at around $ 2,100. Such a break would bring the cryptocurrency back into a bear trend and bring the next support zone between around $ 1,105 and $ 1,420 into play, where a bullish downward correction would be possible.

can the Ethereum course increase to the next Fibonacci resistors?
A closure under the Golden Ratio Support at around $ 2,100 this week would be to be interpreted well. The MACD also shows bearish tendencies in the weekly chart, while the histogram continues to lower. However, the RSI points to overbought regions, and the exponential moving average (EMAS) show a golden crossover in the weekly chart. This could indicate that a medium -term trend remains bullishly confirmed.
If Ethereum can initiate an upward movement, the next significant fibonacci resistances are waiting at around $ 2,658 and $ 3,250.
In the daily type, a death cross has formed
The course remains in a correction movement as long as the Golden Ratio is not exceeded at around $ 3,250. A sustainable break of the Golden Ratio Support at around $ 2,150 could be seen as a bearish trend reversal, which would mark the end of the bull market for Ethereum. The daily type also shows a death cross of the EMAS, which indicates a short -term bear trend. While the MACD lines have crossed the bear, the histogram of the MacD has recently ticked bullishly and the RSI forms a bullish divergence. However, this opens up the possibility of an upward movement and closure over the Golden Ratio at around $ 2,150
A death cross is also active in the 4h chart
In the 4-hour chart there is also a death cross of the EMAS, which indicates a short-term bear trend. Interestingly, the MACD is currently presenting Bullish, since the MacD lines are crossed and the histogram of the MacD Bullish increases. The RSI remains in a neutral position.
against Bitcoin, the Ethereum Course has now received support
against BTC Ethereum has reached the bearish price targets on the support zone between around 0.01615 BTC and 0.02275 BTC, where the course could possibly bump up. If these support levels are broken, the next significant fibonacci resistances are waiting at around 0.0372 BTC and 0.0463 BTC. However, the indicators in the monkey tart show bear signals: the MACD lines have been crossed in a bear and the histogram of the MacD has been berry down for three months. The RSI is approaching oversized regions, but without clear Bullische or Bärische Signals.
Overall, the situation remains tense for Ethereum, and the coming days will be crucial to observe whether a trend change can take place or the bear trend is continued.

 Suche
Suche
 Mein Konto
