Ethereum on the crossroads: Bullic back rash on the Fibonacci support or further falling courses?
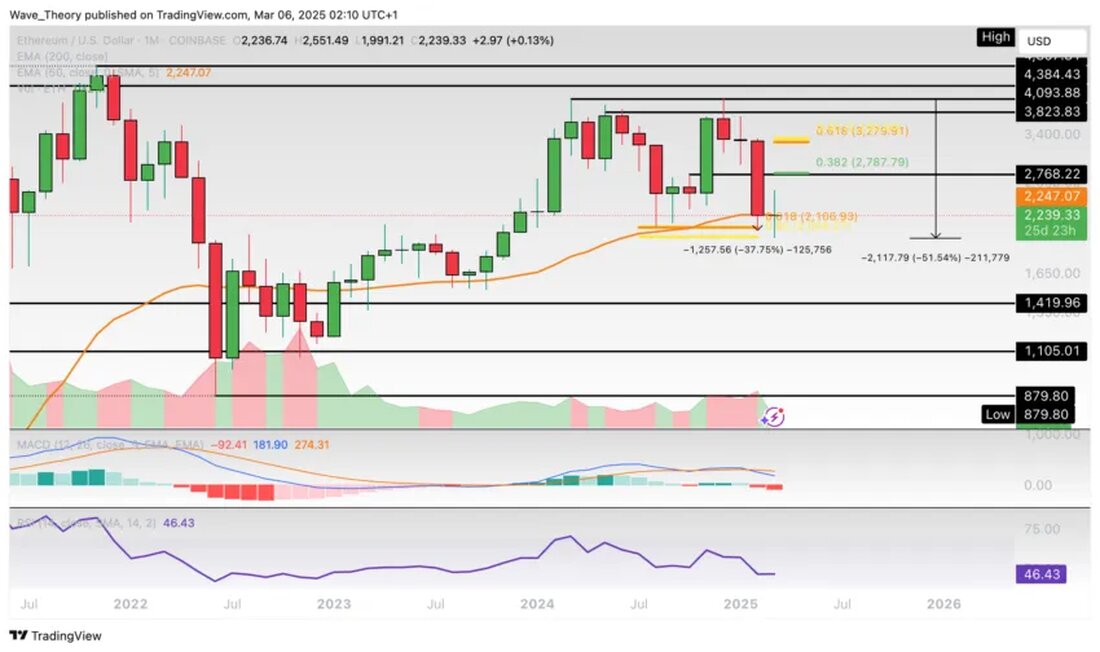
Ethereum forecast for Thursday, March 06, 2025: Will the ETH course at the Fibonacci support bullish? The Ethereum course gave in by around 37 % last month. This month, however, a reversal in the form of a price increase could be emerged. Is Ethereum facing an upward movement? In the past four months, the Ethereum course has fallen by around 51.5 % and has received the Golden Ratio support at around $ 2,100. At this point Ethereum could bounce bullly and initiate an upward movement. The next Fibonacci resistors are around $ 2,788 and $ 3,300. Only in the event of a breakthrough through the Golden Ratio at around 3,300 ...

<p> <strong> Ethereum on the crossroads: Bullic back rash on the Fibonacci support or further falling courses? </strong> </p>
Ethereum forecast for Thursday, March 06, 2025: Will the ETH course at the Fibonacci support be bumped into the Fibonacci support?
The Ethereum course gave in by around 37 % last month. However, this month could be reversed in the form of a price increase.
Ethereum is facing an upward movement?
In the past four months, the Ethereum course has fallen by about 51.5 % and has received the Golden Ratio support at around $ 2,100. At this point Ethereum could bounce bullly and initiate an upward movement.
The next Fibonacci resistors are around $ 2,788 and $ 3,300. Only in the event of a breakthrough by the Golden Ratio at around $ 3,300 could the current correction movement be considered completed. Another increase could target the resistance area between $ 3,823 and $ 4.094. If this resistance breaks, ETH might strive for the all -time high (ATH) at around $ 4,400 or even go beyond
The current indicators send bear signals in Monatschart. The relative strength index (RSI) is in the neutral area, but the MACD lines have crossed Bärisch, while the histogram of the MACD continues to have low values.
indicators in the weekly chart also show bear tendencies
The indicators in the weekly chart are also bearish. While the exponential moving averages (EMAS) through the golden crossover confirms the trend on a medium-term base, the MACD histogram has been showing bearish low levels since last week, and the MacD lines have crossed Bärisch. The RSI remains in a neutral space.
Nonetheless, the course could still bounce bullily. The upward movement remains intact as long as Ethereum above the Golden Ratio supports support of approximately $ 2,100. However, should Ethereum break down this support, the next significant support would be between about $ 1,105 and $ 1,420.
Tart -type shows bullish divergence
In the daily type, the EMAS formed a death cross, which bears the trend in a short to medium -term perspective. However, the RSI indicates a bullish divergence, which indicates that an upward movement could be imminent. In addition, the MacD lines could cross Bullisch, since the MacD histogram has been increasing bullish since yesterday.
Short-term perspective in the 4-hour chart
In the 4-hour chart, the RSI also shows a bullish divergence. The MacD lines crossed Bullisch and the MacD histogram shows an upward trend. The EMAs, on the other hand, have formed a death cross, which confirms the short -term trend. Ethereum already encounters resistance at the 50-4hema at around $ $ $ 2.290. A break of this resistance would expect the next resistance on the 200-4hema at around $ 2,610.
Support against Bitcoin
Against Bitcoin, the Ethereum course could soon meet the support zone between around 0.01615 BTC and 0.02275 BTC, where a bullish reaction is possible. The next significant fibonacci resistors expect ETH at around 0.0378 BTC and 0.047 BTC. The indicators in the month of the month, on the other hand, show Bärische Signals, with Bärically crossed MACD lines and a low histogram for three months. The RSI is gradually moving to oversold areas.
At the next support, a bullish reversal for Ethereum could be possible.

 Suche
Suche
 Mein Konto
