XRP is in the floating, will soon fall $ 0.5 or will another crash come? (Ripple price analysis)
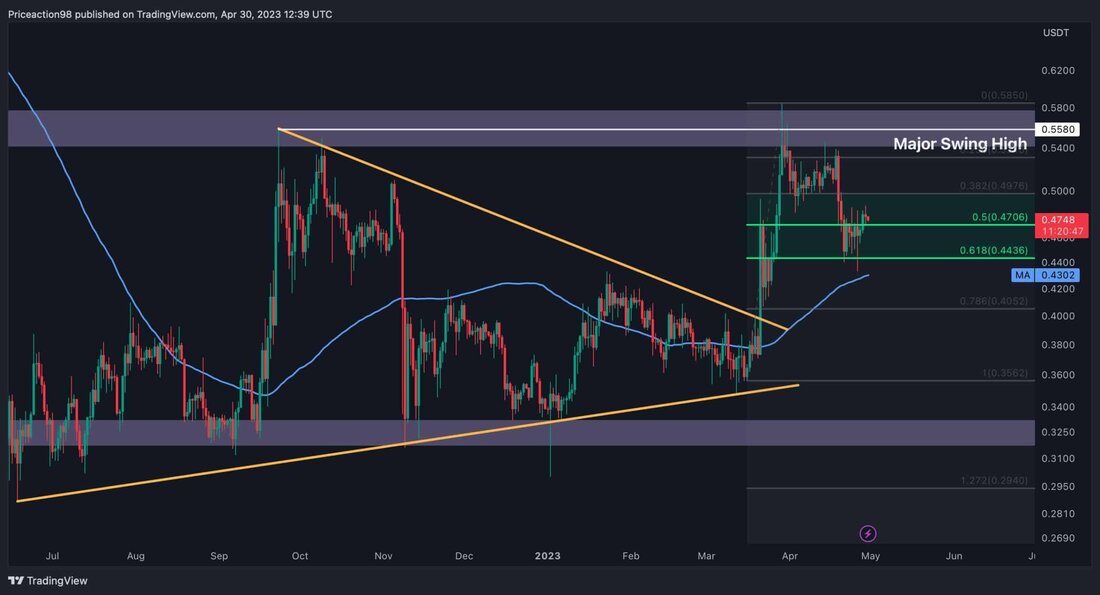
Ripple was unable to break the resistance region of $ 0.55 and experienced a significant break-in of 26 % and achieved the decisive level of support of the sliding 100-day average. However, the price should consolidate within this range and encounter considerable support. Technical analysis of Shayan The daily-type on the daily chart Rippledurch the turning away of $ 0.58 suffered a massive decline and recorded a decrease of a whopping 26 %. However, XRP is currently confronted with significant support regions, which consist of the sliding 100-day average at $ 0.43 and the 61.8 % Fibonacci retracement level at $ 0.44. In view of the strength of these support levels, ...

XRP is in the floating, will soon fall $ 0.5 or will another crash come? (Ripple price analysis)
ripple could not break the resistance region of $ 0.55 and experienced a significant break-in of 26 % and achieved the decisive level of support of the sliding 100-day average. However, the price should consolidate within this range and encounter considerable support.
technical analysis
of Shayan
the daily -type
Following the daily chart Rippledurch the turning of $ 0.58 suffered a massive decline and recorded a decline of a whopping 26 %. However, XRP is currently confronted with significant support regions, which consist of $ 0.43 and the 61.8 % Fibonacci retracement level at $ 0.44.
In view of the strength of these support levels, the price probably seems to enter into a consolidation phase, followed by high volatility. However, the sales pressure puts a ripple the price under the sliding 100-day average, a further decline could occur, which could rinse many long positions from the derivative market. Tradingview
The 4-hour diagram
On the 4-hour chart, the price has formed a descending price channel. The most recent rejection led to XRP falling below the small level of support of $ 0.48 and consolidated without a clear direction. At the moment it sees two decisive levels: the small resistance zone of $ 0.48 and the lower trend line of the channel, which is around $ 0.415.
In relation to the Ripplenbuß of the latest behavior, the market appears to have occurred in a consolidation phase between $ 0.415 and $ 0.48 until it comes to an outbreak from this range.
Tradingview
.

 Suche
Suche
