 Suche
Suche
 Mein Konto
What to expect after a new ATH for BTC?

The price of Bitcoin continues to show strength and is trading very close to all-time highs, with an intraday high of around $64,600 (on Bitstamp) at the time of this writing. Spot volume has been increasing for days, which is a sign of strength. BTC price action was impressive on the day the futures-backed BTC ETF began trading. However, in the short term, it is important to remain cautious as open interest continues to rise - currently at $14.4 billion. The estimated leverage ratio also remains elevated despite funding rates falling to neutral. Chart according to TradingView Technical indicators of Bitcoin price Bitcoin accelerated …
What to expect after a new ATH for BTC?
The price of Bitcoin continues to show strength and is trading very close to all-time highs, with an intraday high of around $64,600 (on Bitstamp) at the time of this writing.
Spot volume has been increasing for days, which is a sign of strength. BTC price action was impressive on the day the futures-backed BTC ETF began trading. However, in the short term, it is important to remain cautious as open interest continues to rise - currently at $14.4 billion. The estimated leverage ratio also remains elevated despite funding rates falling to neutral.
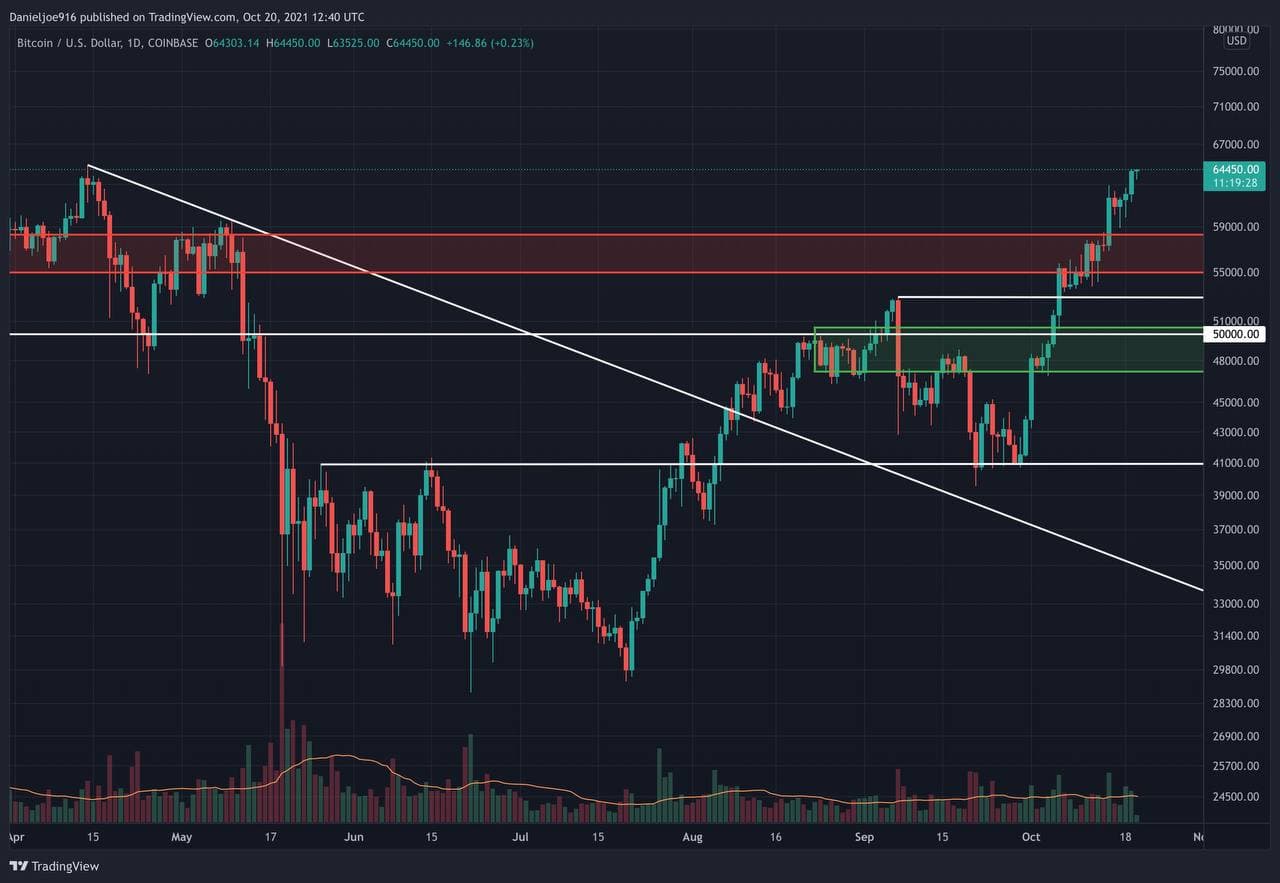 Chart according to TradingView
Bitcoin price technical indicators
Bitcoin accelerated higher as soon as the price closed above the range between $57,100 and $58,300, which was previously a high technical and on-chain resistance level. The medium to long-term momentum indicators are decidedly bullish, pointing to significant upside potential in the coming weeks and months.
The Wyckoff accumulation has finally reached its Phase E mark-up. It is worth noting that the first breakout in September above $52.9K turned out to be a fakeout and led to massive liquidations, leading to a decline to $39.6K. This formed the “final base,” a higher low.
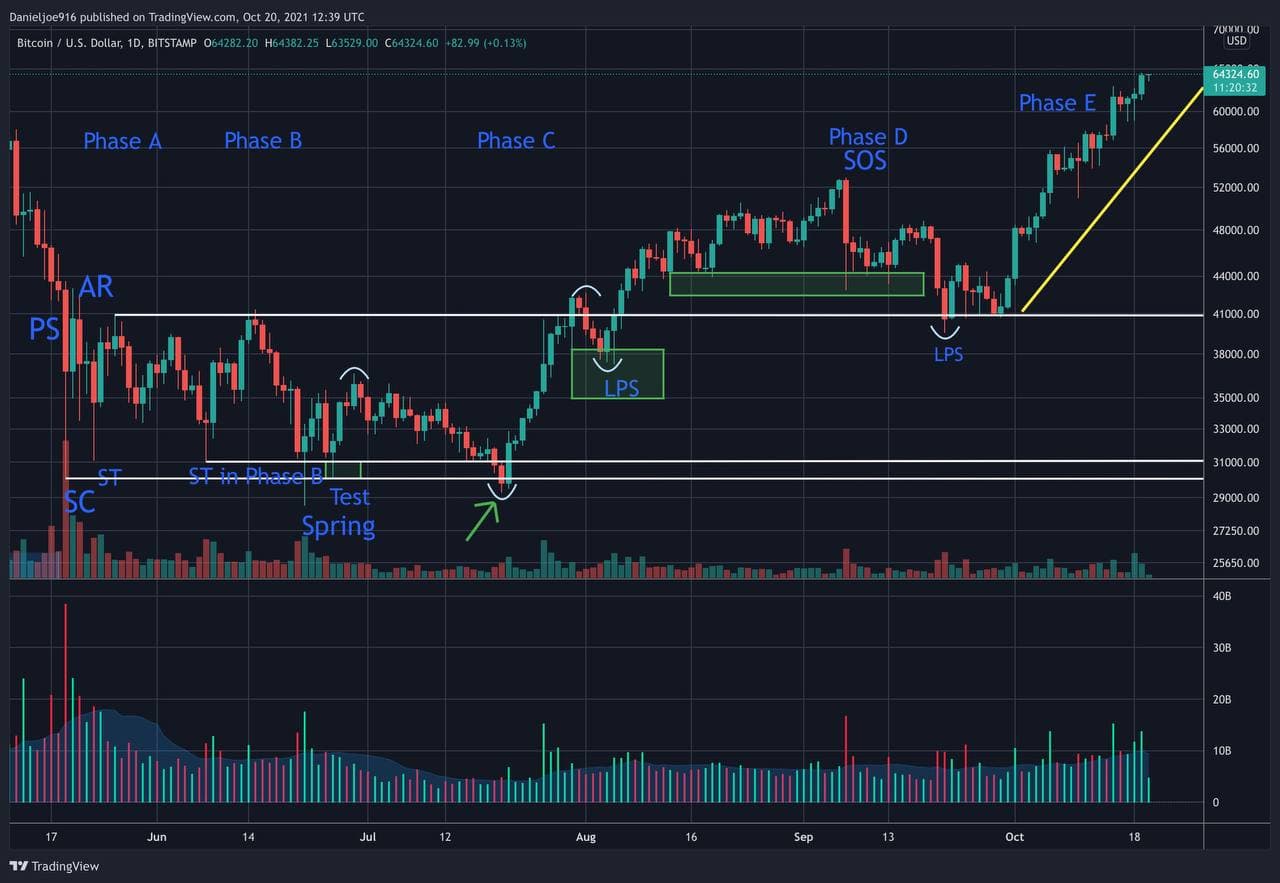 Chart according to TradingView
BTC’s price is now attempting to hit a third consecutive weekly close above $52,900 and push deeper into Phase E to add to their positions.
Given the current hype surrounding the BTC ETF, increased open interest, and relatively high estimated leverage ratio, the risk of a short-term liquidation event is always something to consider. In the event of a pullback, short-term support levels include $61.7K, $60K, $58.3K, $57.1K, and possibly $55K-52.9K.
On-chain analysis of BTC price
The impressive spot purchases dropped reserves by almost 4,650 BTC, sending spot exchange reserves to an all-time low. They have been declining for a week, which is a bullish signal and means BTC is being sent away from exchanges.
Stablecoin reserves continue to trend downward, suggesting they are flowing back into the market. The stablecoin supply ratio – which measures BTC market cap to the total stablecoin market – has increased, which is also a historically bullish signal.
The overall mean coin age (MCA) also continues to trend upward despite the light distribution. We see some distribution from the 3-5 year and 12-18 month cohorts, but overall other groups are holding, causing the MCA to increase. We can also expect the distribution trend to begin either just before or after a new all-time high.
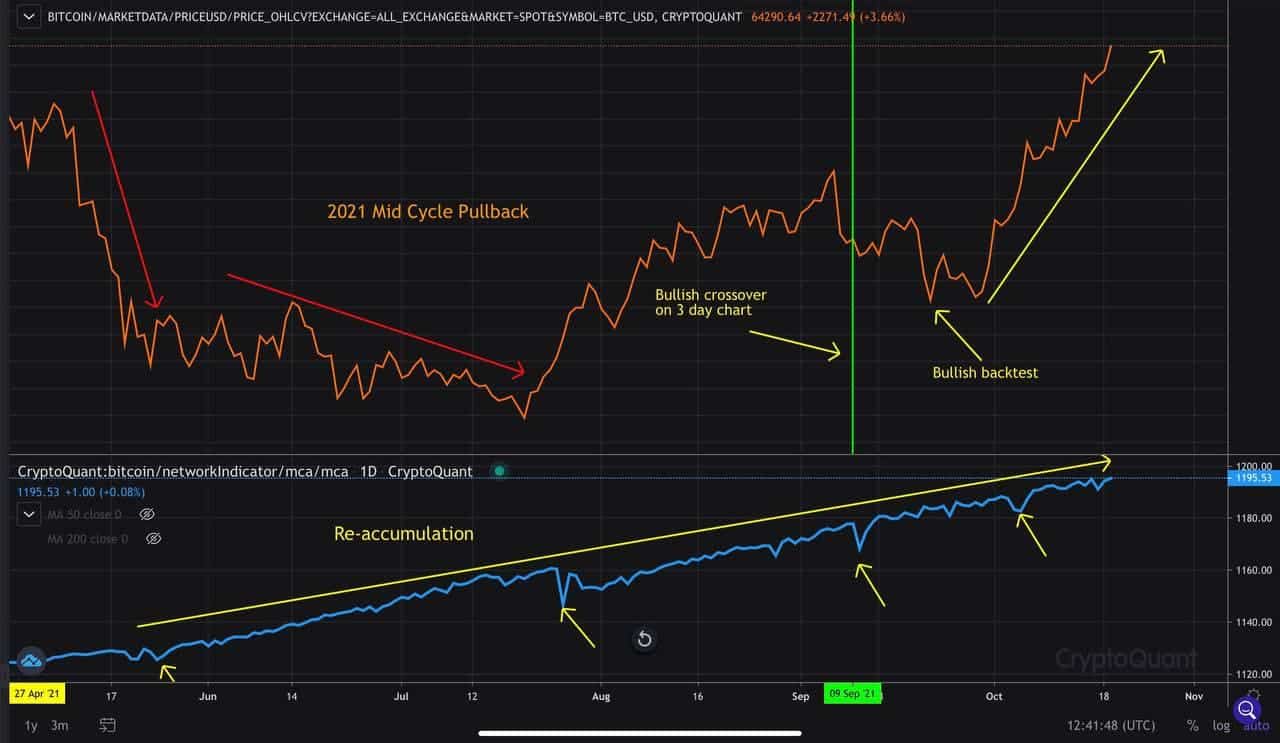 Chart from CryptoQuant
In 2013, during the bull market, we saw this trend begin before BTC climbed above the previous cycle high. Long-term holders will eventually make a distribution and it is important to track when it begins as well as the rate of that distribution.
Macro perspective
The SPX closed above 4488 and 4500 – two key resistance levels, further suggesting that the risk-on trade is returning. This could give BTC a macro tailwind heading into the fourth quarter.
The dollar remains below a key technical level and is trending lower. Meanwhile, money continues to flow out of long-term bonds, showing that capital is rotating back into stocks and potentially towards BTC.
As we previously reported, earnings season is beginning, which could reveal certain large Bitcoin purchases on behalf of large companies - this could act as an important catalyst for the bull market.
In general, bulls are in control and a possible market shakeout is likely to be bought up.
.