 Suche
Suche
 Mein Konto
After Bitcoin’s Bullish Weekly Close, These Are the Next Possible Targets (BTC Price Analysis)

BTC managed to post a strong weekly close above $52.9K, the September highs, further confirming the bear trap at $39.6K. After holding the higher low at $40.7k, a level we have been watching closely, BTC successfully followed higher and printed a second weekly candle higher. This confirms the previous week's bullish engulfing candle and strengthens the short-term technical momentum and structure. Although last week's technical conditions were slightly overbought, BTC managed to follow the ideal scenario by consolidating sideways while maintaining the $55,000 level as support...
After Bitcoin’s Bullish Weekly Close, These Are the Next Possible Targets (BTC Price Analysis)
BTC managed to post a strong weekly close above $52.9K, the September highs, further confirming the bear trap at $39.6K. After holding the higher low at $40.7k, a level we have been watching closely, BTC successfully followed higher and printed a second weekly candle higher.
This confirms the previous week's bullish engulfing candle and strengthens the short-term technical momentum and structure. Although last week's technical conditions were slightly overbought, BTC managed to follow the ideal scenario by consolidating sideways while holding the $55,000 level as support.
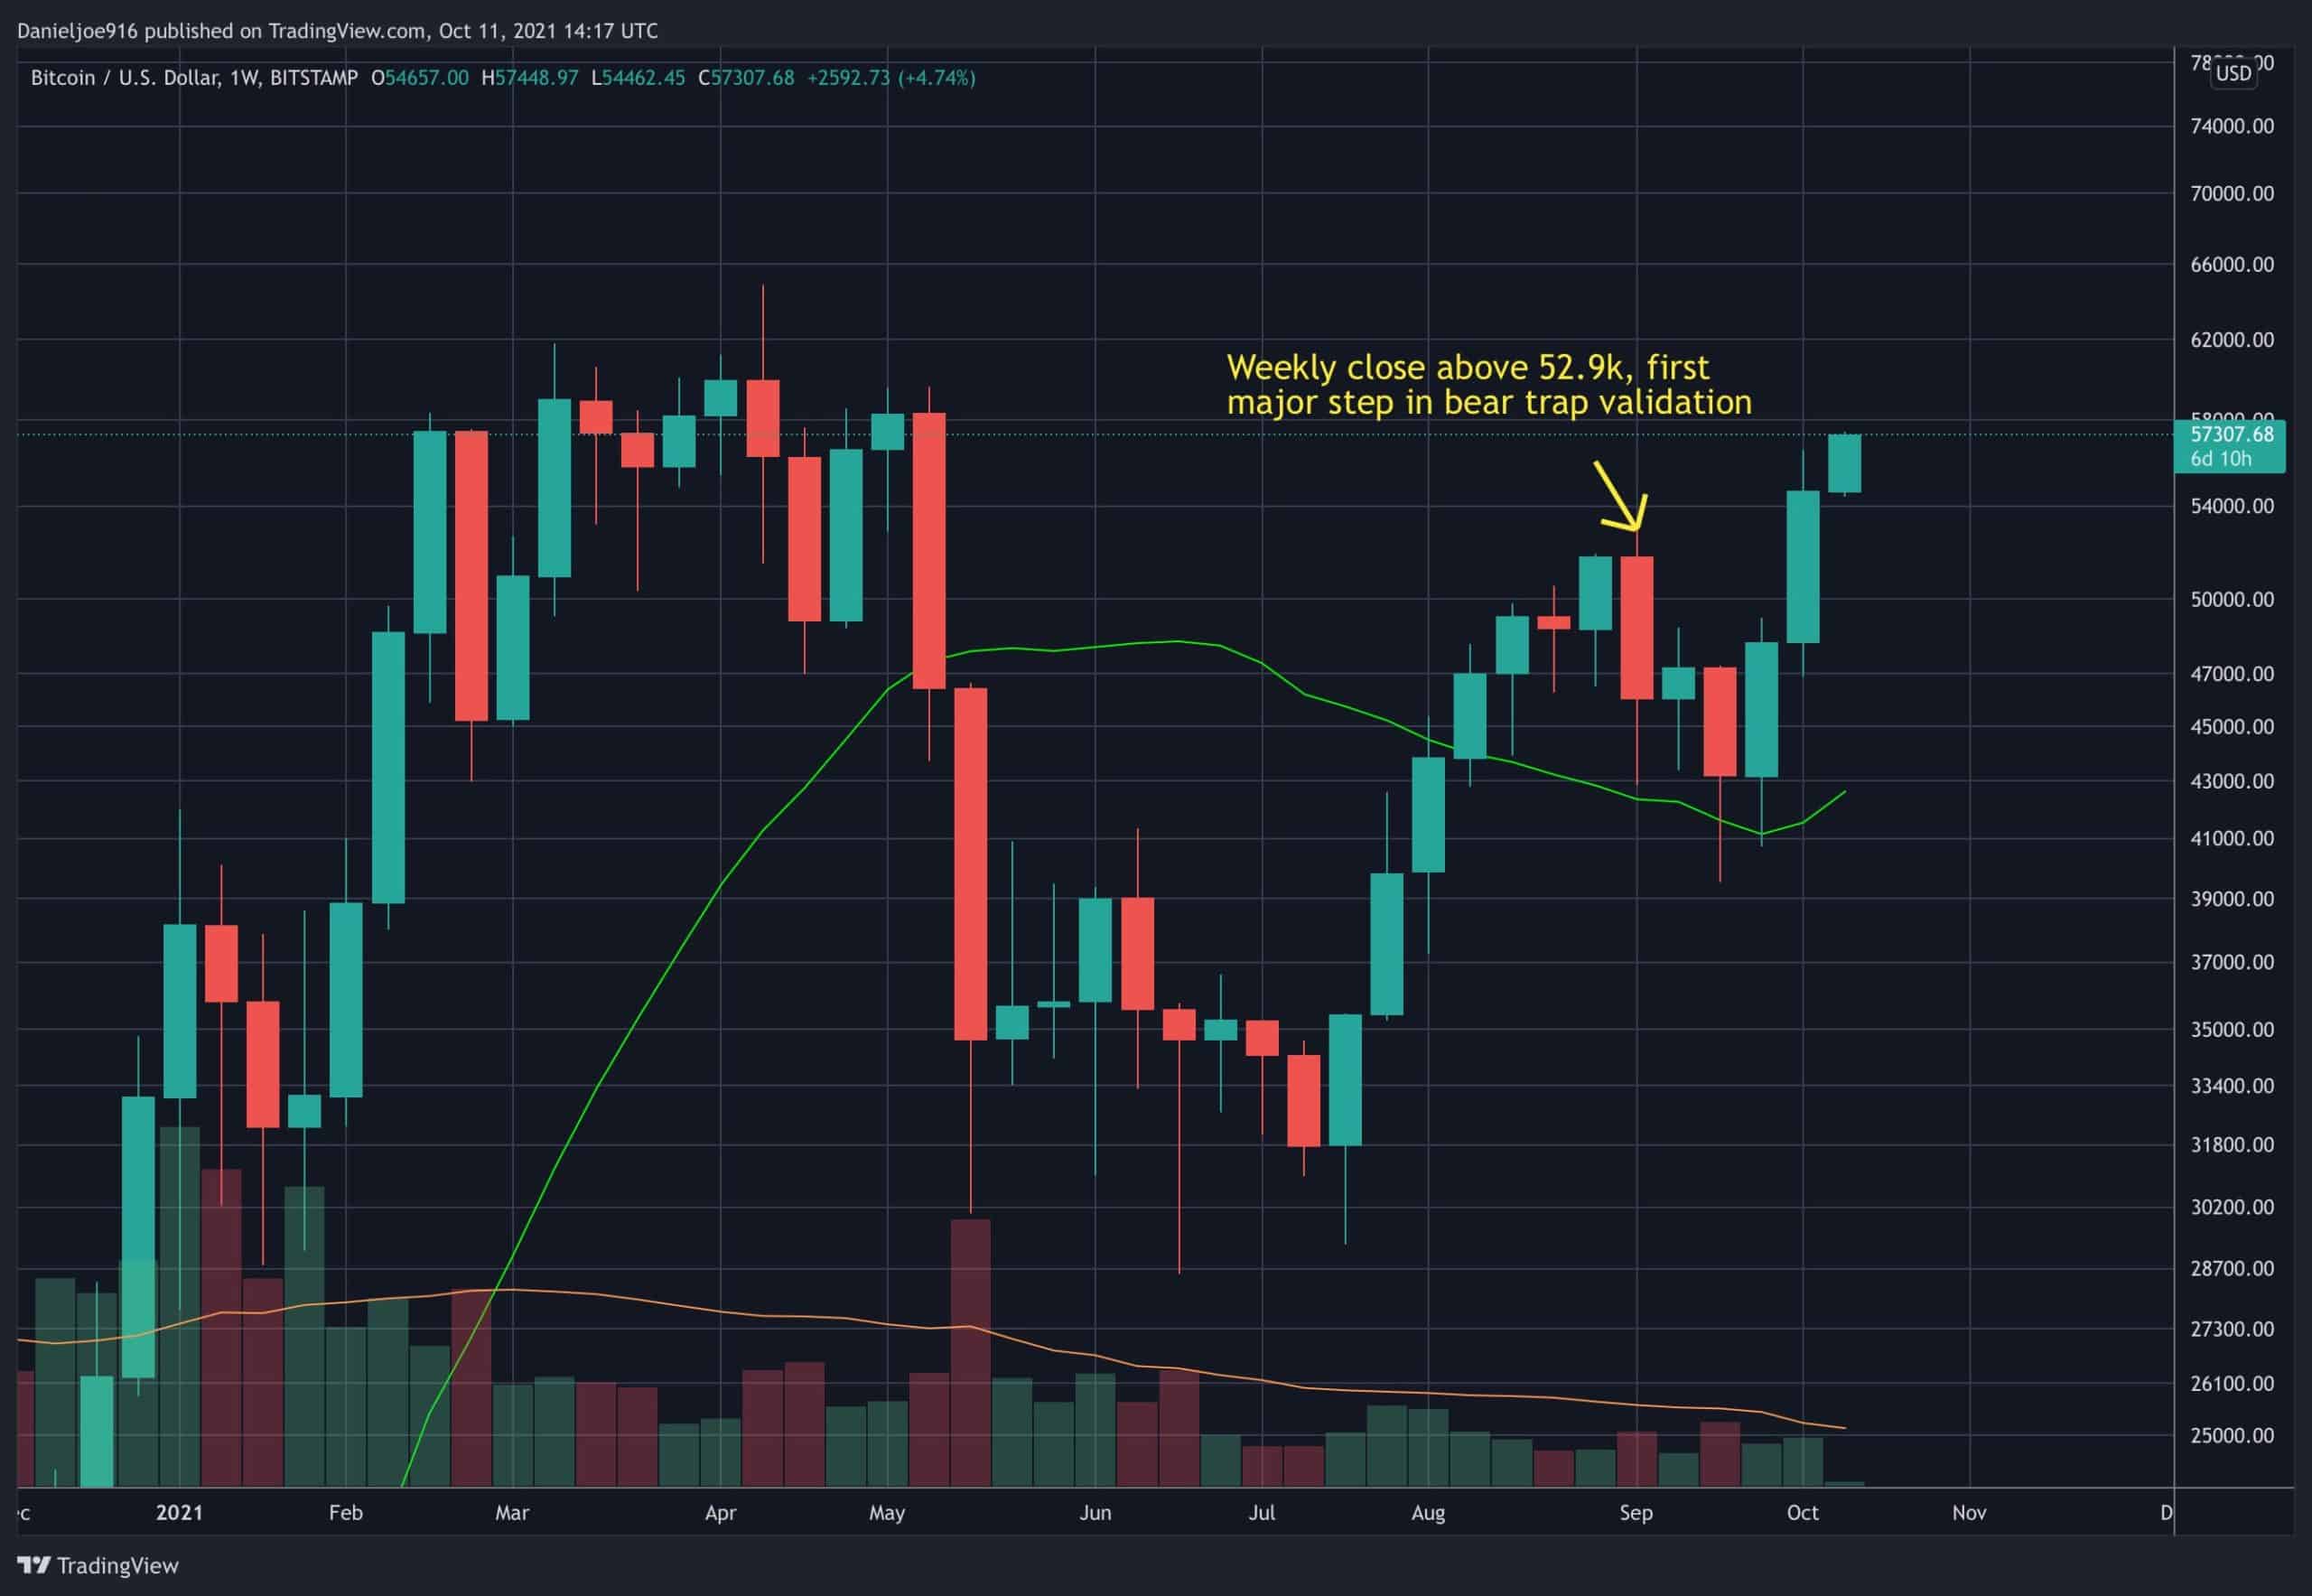 Chart according to TradingView
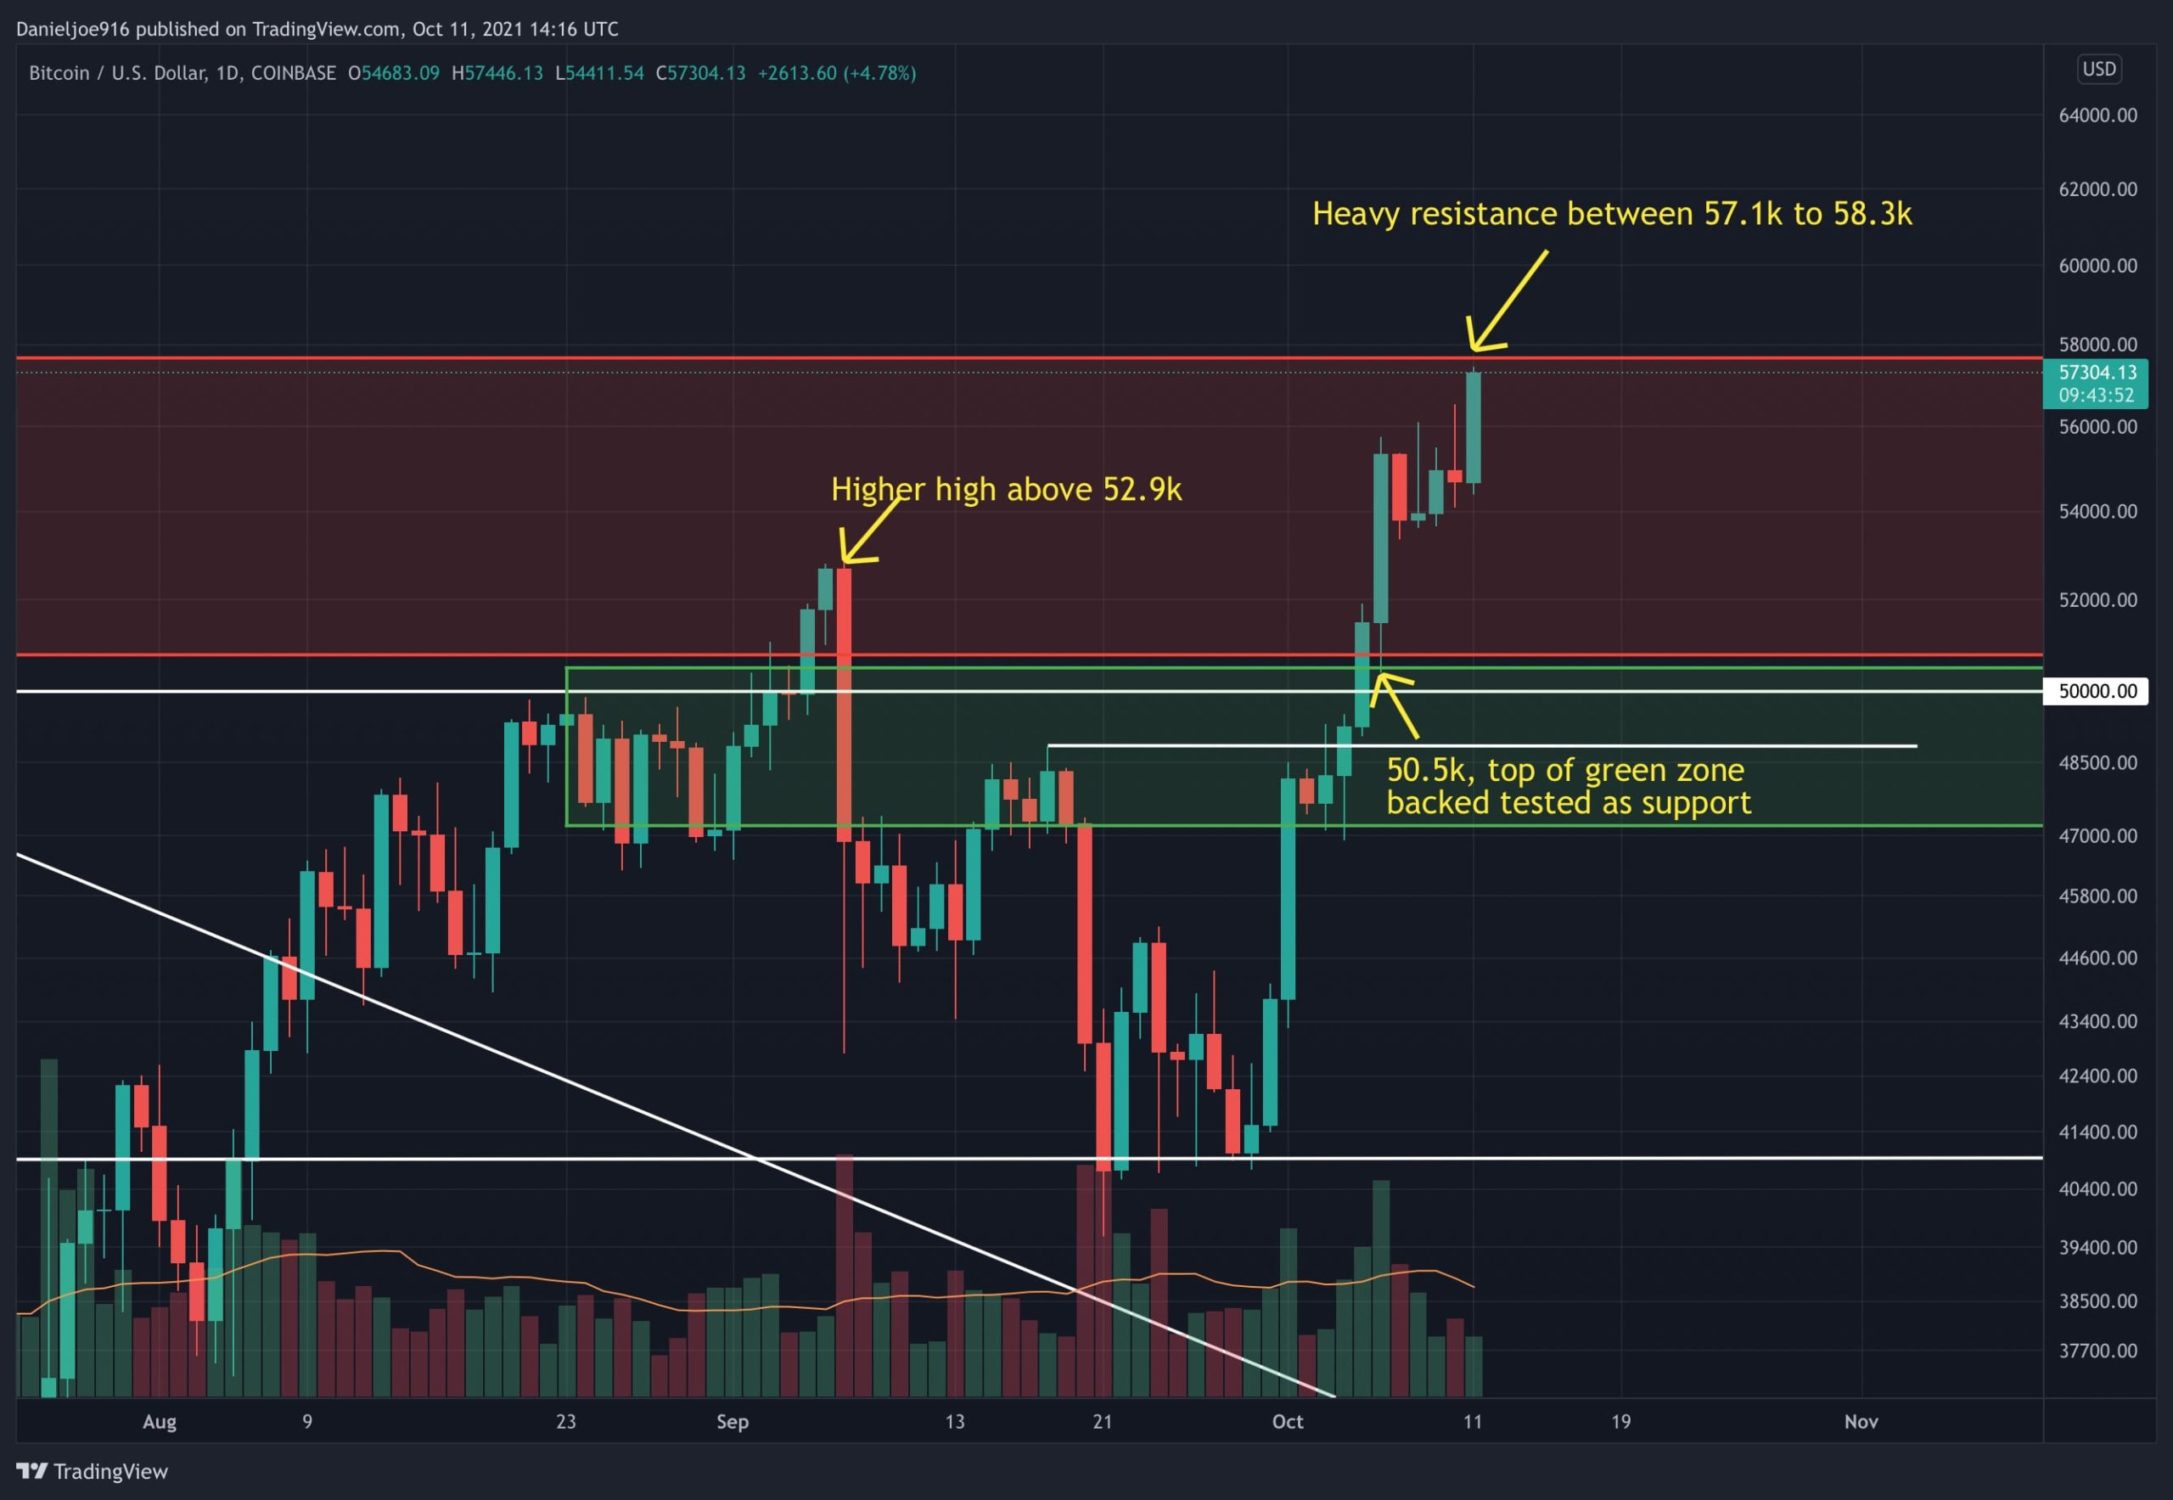 Chart according to TradingView
It is important for BTC to continue holding above $52.9K this week and follow higher. It is now moving deeper into the main resistance zone between $55,000 and $58,000, an area with strong technical and on-chain resistance.
Many buyers who purchased BTC above $50,000 earlier this year are probably looking to break even. This could increase short-term selling pressure between $55,000 and $58,000, making it very important for bulls to step in and absorb the incoming supply in the market. Once the supply is exhausted, we can expect BTC to rise above $58k and retest the all-time highs at $64.8k as there is less technical and on-chain resistance above $60k.
On-chain continues to show strength
Although BTC is entering a severe resistance zone between $55,000 and $58,000, on-chain metrics continue to show no signs of greater distribution among long-term holders and miners, further suggesting a continuation of the bull run. During last week's consolidation, spot exchanges saw a slight increase in inflows, mainly because some whales and traders took profits after BTC quickly rose more than 35% from the lows.
Most of the sales came from short-term holders, which was confirmed by the UTXO age distribution metric, which shows sales of coins 3 months old or younger and an increase in STH SOPR.
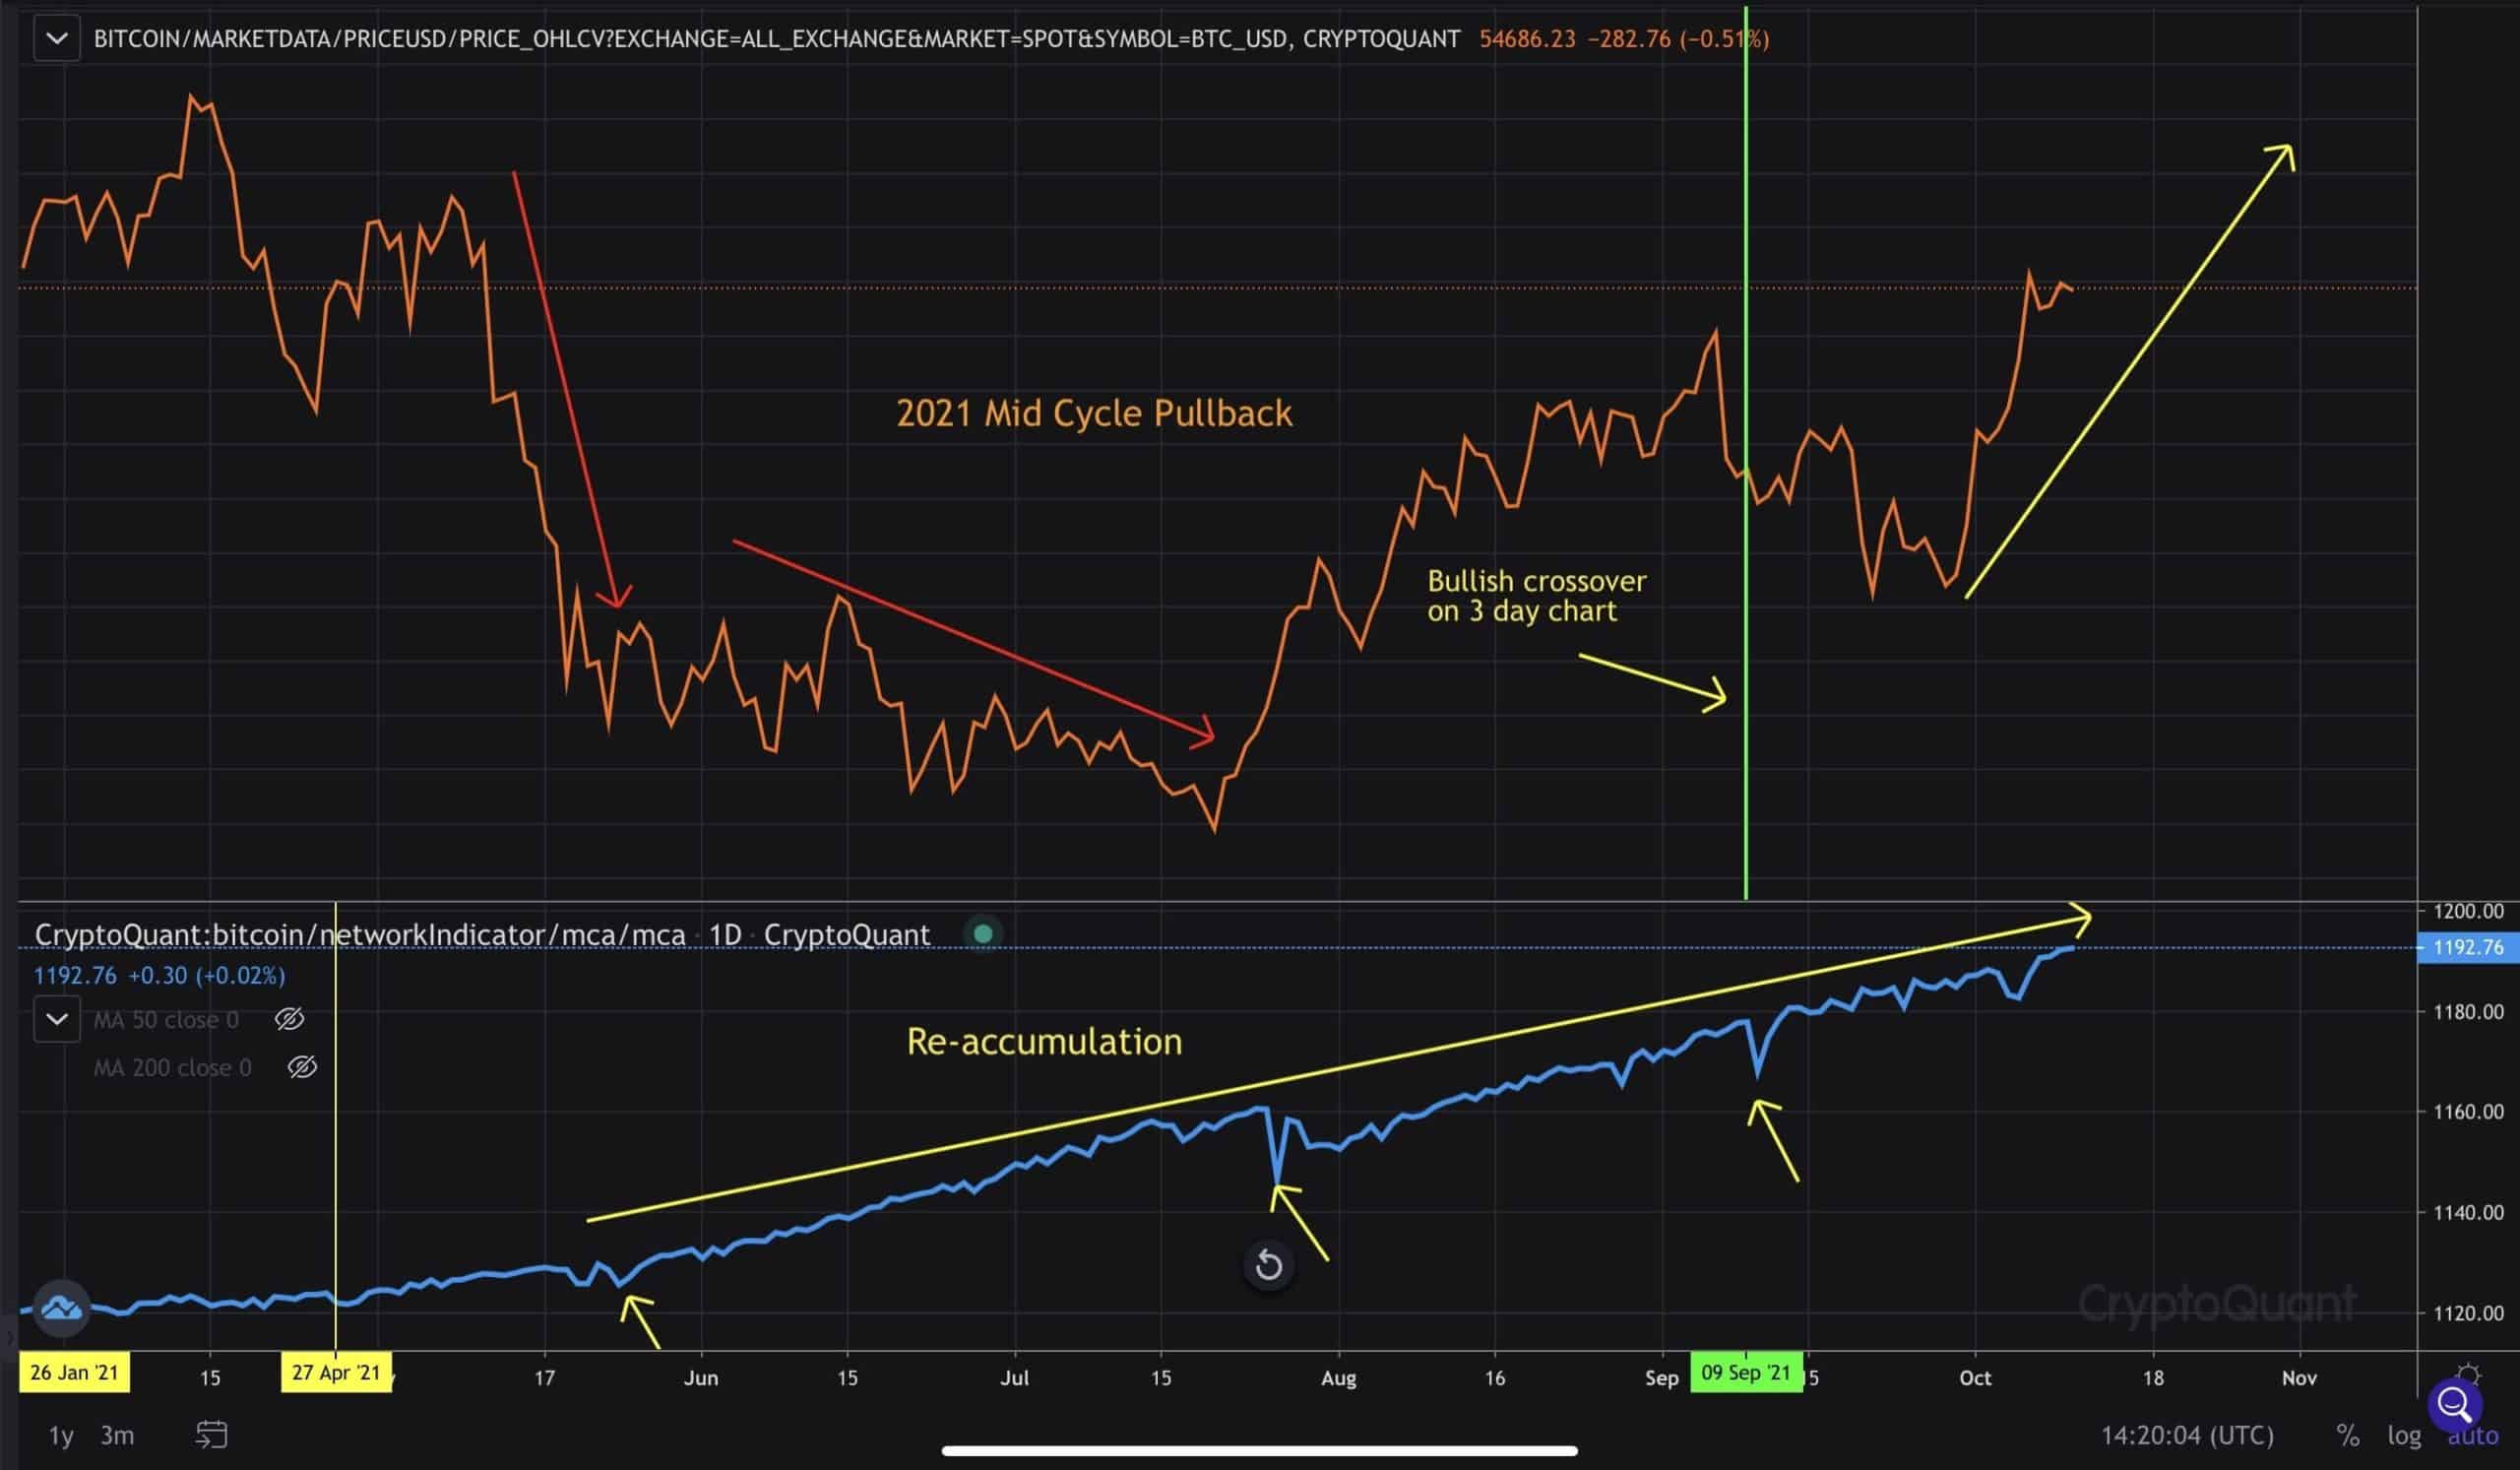
Despite consolidation and short-term profit-taking, CryptoQuant's Mean Coin Age continued to trend higher, reaching new all-time highs. This clearly shows that long-term holders have not sold this rally and continue to HODL their BTC.
CryptoQuantBTC's chart has continued to outperform the SPX despite global risk moderation and a rising dollar. With the SPX forming a double bottom with multiple consecutive daily higher closes, money flowing out of long-term bonds and the dollar stagnating, the market is showing potential signs of the risk of trading resuming.
Once investors get past the short-term uncertainties, we can expect trillions of dollars of liquidity to flow back into risk assets, particularly BTC. For now, BTC bulls will continue to battle the bears as the price is now testing the critical $57.1K-$58.3K resistance zone.
Given the strong trend in fundamentals and on-chain metrics, it is more likely that BTC is on its way to new all-time highs later this month or in November.
.