Here is the next support for ETH if $ 1500 fails (Ethereum price analysis)
The price of Ethereum seems to have entered a short -term correction phase, since the cryptocurrency was recently rejected and crashed from an important resistance zone. Nevertheless, there are two decisive support levels that could end the current decline. Technical analysis of Shayan The daily type The price recently recovered and left a symmetrical triangular pattern for several months. However, the dynamics have weakened. After this decline, Ethereum is now in front of the upper trend line of the triangle, which acts as a decisive level of support. The renewed test of the upper trend line of ETH at $ 1.5,000 could be seen as a withdrawal to the opened level to the outbreak ...

Here is the next support for ETH if $ 1500 fails (Ethereum price analysis)
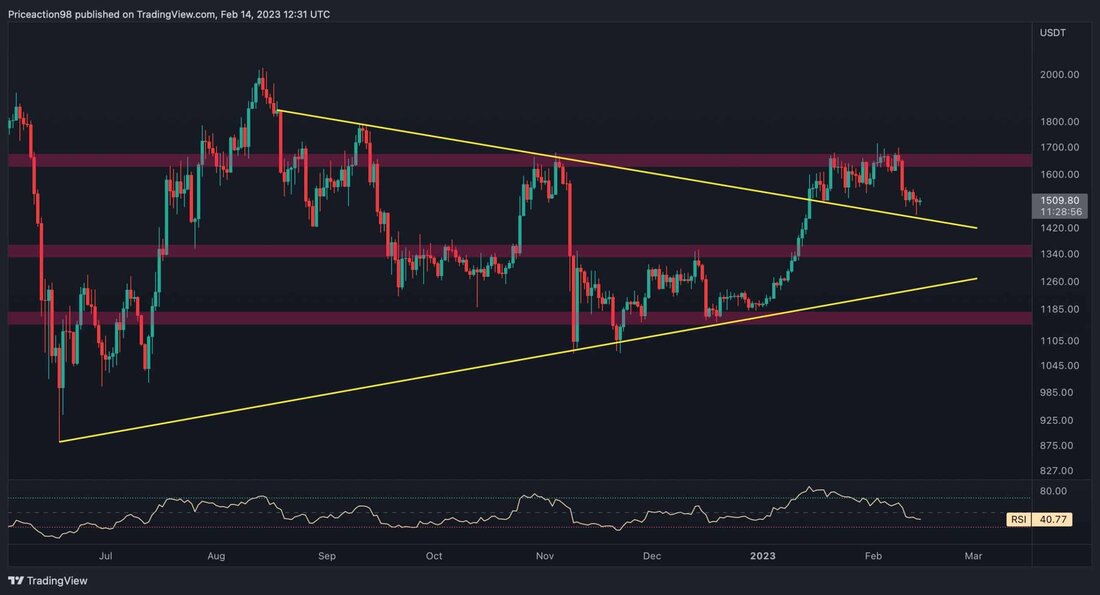
The price of Ethereum seems to have entered a short -term correction phase, since the cryptocurrency was recently rejected and crashed from an important resistance zone. Nevertheless, two decisive support levels are imminent that could end the current decline.
technical analysis
of Shayan
the daily -type
The price recently recovered and left a multi -month symmetrical triangle pattern. However, the dynamics have weakened. After this decline, Ethereum is now in front of the upper trend line of the triangle, which acts as a decisive level of support.
The renewed test of the upper trend line of ETH at $ 1.5,000 could be seen as a withdrawal to the opened level in order to confirm the outbreak and continue to rise. If the price falls below the trend line, the $ 1350 region will be the next stop of the price.
Tradingview
The 4-hour diagram
There are three decisive resistance/support price regions on the Ethereum chart in the 4-hour time frame; The $ 1700 region as resistance and the $ 1350 and $ 1150 zones as support. The price fluctuates between $ 1700 and $ 1350 and could remain at this span at short notice.
On the other hand, the Fibonacci levels of 0.618 ($ 1319) and 0.5 ($ 1394) of the latest impulsive rally agree with the support region of $ 1350, which makes it a decisive level to be taken into account. Therefore, the price probably seems to consolidate and then rise in the direction of the support area of $ 1350.
Tradingview
on-chain analysis
of edris
Ethereum Taker Buy Sell Ratio (SMA 100)
The Futures market has been one of the most important factors in determining the short-term prize movement of ETH in recent years. Therefore, the analysis of the mood could provide useful knowledge.
This diagram shows the taker-Buy-Sell ratio metric with a sliding 100-day average, which is used for better visualization. This key figure shows whether the bulls or bears carry out their orders more aggressive. Values over 1 indicate a bullish market mood, while values under 1 indicate sales pressure on the futures market.
While this key figure has been over 1 for some time, it has recently declined. This indicates that the purchase pressure subsides and if it falls below 1, the market would probably fall to a new low because the sellers would dominate again.
This key figure should be carefully observed in the coming weeks to determine whether the youngest rally was really the beginning of a new bull market or just another bull trap.
Cryptoquant
.

 Suche
Suche
 Mein Konto
