Has Bitcoin marked a local top? Here is the level to be observed: BTC price analysis
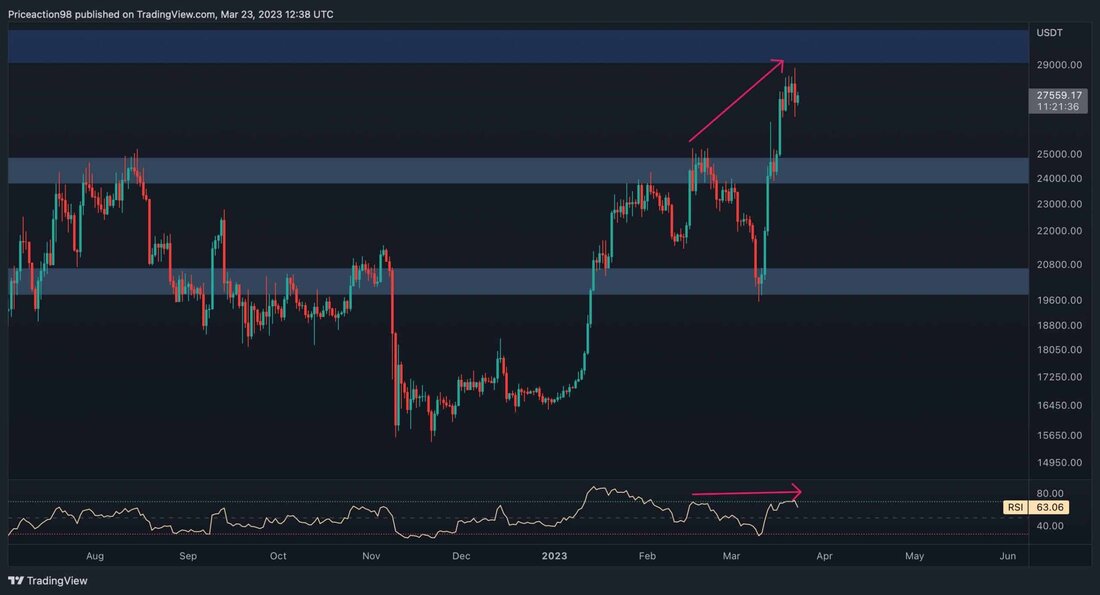
Bitcoin's impulsive rally seems to have temporarily stopped, and the price will probably enter a correction phase before the next increase. Overall, Bitcoin faces a considerable resistance at the level of $ 30,000 that has not yet been tested. Technical analysis of Shayan After a pullback to the 61.8%level of the Fibonacci entry level at 19.6,000 USD, the price initiated a massive rally with a current high of over $ 28,000. However, the Haussiers could not reach the significant resistance area of $ 30,000. This price range also acts as a psychological resistance zone, since many traders believe that the bear market ...

Has Bitcoin marked a local top? Here is the level to be observed: BTC price analysis
The impulsive rally from Bitcoin seems to have temporarily stopped, and the price will probably enter a correction phase before the next increase. Overall, Bitcoin faces a considerable resistance at the level of $ 30,000 that has not yet been tested.
technical analysis
of Shayan
the daily -type
After a pullback to the 61.8%level of the Fibonacci entry level at 19.6,000 $ 19.6,000, the price initiated a massive rally with a current high of over $ 28,000. However, the Haussiers could not achieve the significant resistance range of $ 30,000.
This price range also acts as a psychological resistance zone, since many retailers believe that the bear market will be officially finished as soon as the price exceeds the $ 30,000 mark. Nevertheless, a clear divergence between the course and the RSI indicator can be identified, which may lead to a short-term correction or consolidation phase.
The 4-hour diagram
The impulsive bullish rally is clearer in the 4-hour time frame. However, the latest price movements indicate that the interest bully momentum has decreased and the price will probably enter a short-term consolidation or correction phase.
Bitcoin could test two important support levels in this scenario: the significant level of support of $ 25,000 and the price zone between the 0.5 and 61.8-fib retracement levels, about $ 24.4,000 and
Nevertheless, there is also a divergence between the price and the RSI indicator in the 4-hour period, which increases the likelihood of short-term correction before the next significant movement.
on-chain analysis
of Shayan
As a result of the latest increase in the Bitcoin Prize, retailers see that their portfolios increase over the profit threshold, which leads to a shift towards a positive market mood.
The not implemented net profit and loss (Nupl) measures the profit or loss of all coins as a ratio that is calculated by dividing the difference between market capitalization and realized capitalization by the market capitalization.
on the assumption that the last coin transmission is due to a purchase, Nupl shows the total profit or loss of all coins. After months of negative values, the youngest rally led Nupl into the yellow zone, which means that more investors are now making profits. This shift can be interpreted as a bullish signal since fewer market participants are put under pressure to sell their coins to prevent further losses.
.

 Suche
Suche
