ETH slips towards $ 1.5,000, but how much deeper can it go? (Ethereum price analysis)
Ethereum's price has decreased in the past few days after it was rejected from a significant resistance zone a few weeks ago. It would therefore make sense to analyze the available support levels that could potentially stop the downturn. Technical analysis of: EDRIS DER TAGTART: On the daily chart, the course fell below the sliding 50-day average, which is around $ 1600 mark. This happened after a rejection of the key level of $ 1800 and the higher limit of the large symmetrical triangular pattern. At the moment, the market seems to be on the sliding 200-day average, which is moving around the price level of $ 1400. If this significant sliding ...

ETH slips towards $ 1.5,000, but how much deeper can it go? (Ethereum price analysis)
The price of Ethereum has decreased in the last few days after it was rejected from a significant resistance zone a few weeks ago.
It would therefore make sense to analyze the available support levels that could potentially stop the downturn.
technical analysis
from: Edris
the daily type:
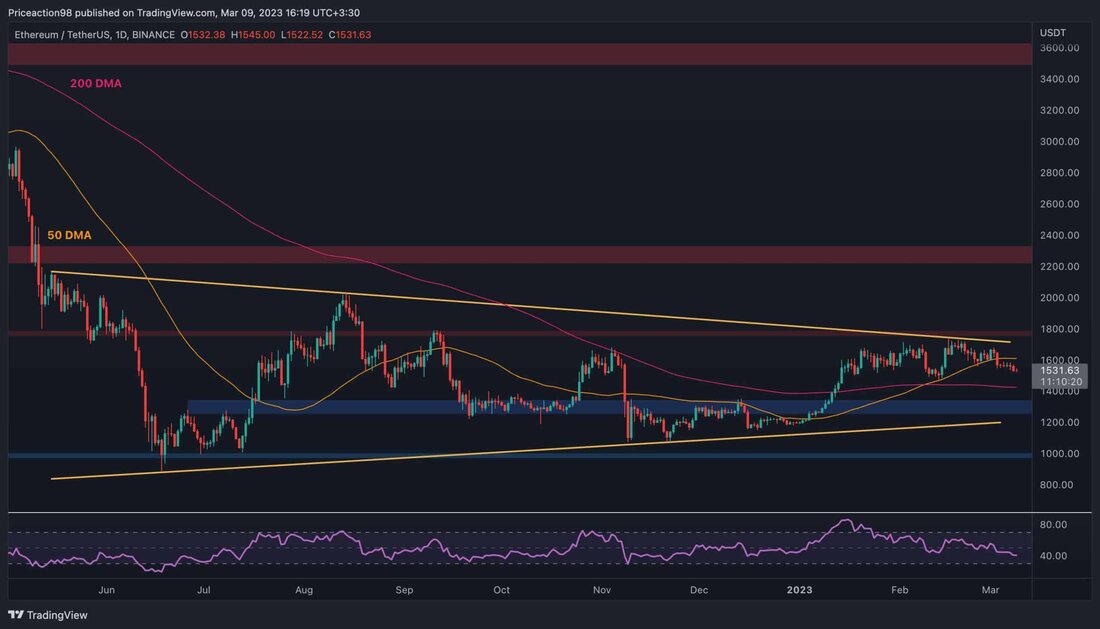
The course fell on the daily chart below the sliding 50-day average, which is around $ 1600 mark. This happened after a rejection of the key level of $ 1800 and the higher limit of the large symmetrical triangle pattern.
The market currently seems to be on the sliding 200-day average, which is moving around $ 1400. If this significant moving average is broken, the price should fall in the direction of the support brand of $ 1300 at short notice.
If the price alternatively recovered from the 200-day Mа mentioned, the 50-day Mа would now act as a resistance level. This would follow the higher limit of the triangle.
Tradingview
The 4-hour diagram:
If you look at the 4-hour chart, it becomes clear that the price of ETH between the level of $ 1680 and the area of $ 1500 has consolidated. The level of support of $ 1500 will soon be tested, and the short -term future of ETH's price campaign will depend on how the price develops there.
If it holds, a recovery and rally will be in the direction of the resistance zone of $ 1680.
If the price should fall below the $ 1500 mark, a further decline towards the $ 1350 area would be the most likely result in the coming days. In addition, the RSI indicator currently shows values below 50 %, which indicates that the bears control the market.
Tradingview
onchain analysis
of Shayan
The metric "active addresses" offers a view of the tummy side of Ethereum and shows the total number of clear active addresses, including senders and recipients. The metric was in a downward trend during the declining market cycle, which indicates a falling demand.
A downward trend for active addresses is typical during the surrender phase of the market. The key figure recently fell for a new annual low, which shows that the demand is not sufficient to end the bear market. Therefore, the market requires more activity to start a healthy upward cycle.
Cryptoquant
.

 Suche
Suche
 Mein Konto
