ADA loses 10 %weekly, are $ 0.30 in the game? (Cardano price analysis)
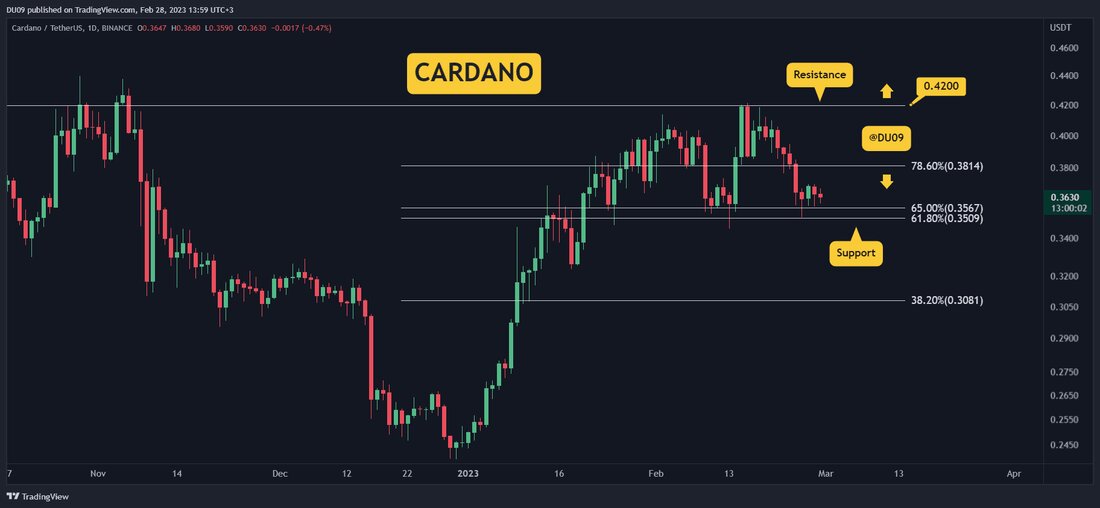
Cardano's downward trend continued last week and has achieved critical support. Can the price keep here? Important support levels: $ 0.35, $ 0.30 Important resistance level: $ 0.38, $ 0.42 Ada fell by 15 %after it was rejected on the 42 cent resistance. He reached the key support at 35 cents. Buyers have the difficult task of defending the price at this important level. Each weakness can quickly be used by sellers who could strive for $ 0.3 next. Diagram of TradingView Commercial volume: The volume closed yesterday in the red area, but the sales intensity decreased. This shows that ...

ADA loses 10 %weekly, are $ 0.30 in the game? (Cardano price analysis)
The downward trend of Cardano continued last week and has achieved critical support. Can the price keep here?
Important support levels: $ 0.35, $ 0.30
Important resistance level: $ 0.38, $ 0.42
Ada fell by 15 %after it was rejected on the 42 cent resistance. He reached the key support at 35 cents. Buyers have the difficult task of defending the price at this important level. Each weakness can quickly be used by sellers who could strive for $ 0.3.
Diagram of Tradingview
trade volume: The volume closed yesterday in the red area, but the sales intensity decreased. This shows that the bears have lost some interest in moving the price down.
rsi : The daily RSI is less than 50 points and falls. As long as the RSI does not move over this center, the bears have control.
macd : The daily MacD histogram forms lower lows and the sliding average. This results in a declining tendency.
Diagram of Tradingview
bias
The tendency for ada is declining.
Short-term forecast for the ADA Prize
While ADA continues to keep the key support just over 35 cents, the pressure on the price builds up. If the buyers fail to move it up, another boost from Bären could break this support and quickly bring this cryptocurrency back to 30 cents.
.

 Suche
Suche
 Mein Konto
