 Suche
Suche
 Mein Konto
Ada fights to close above a critical level of resistance

ADA/USD bulls fight for the ground over 20-day-MA important support levels: $ 2.20, $ 2.00, $ 1.95. Ada recovered on Friday from the support of $ 2 (0.618 fib) and broke the descending trend line from September. Although he climbed over the 20-day MA and reached up to $ 2.36 (Bärische 0.382 FIB), he could never close above this level. At the weekend, Ada continued to act under the 20-day-MA because it could not build a sustainable momentum about it. A strong closing candle would signal that ADA is ready to approach the September highs again. Ada/USD-Ta-type. TradingView. Ada-USD short-term ...
Ada fights to close above a critical level of resistance
ada/USD bulls fight for ground over 20-day-ma
Important support level: $ 2.20, $ 2.00, $ 1.95
Important resistance levels: $ 2.36 $, $ 2.50
Ada recovered on Friday from the support of $ 2 (0.618 fib) and broke the descending trend line from September. Although he climbed over the 20-day MA and reached up to $ 2.36 (Bärische 0.382 FIB), he could never close above this level.
At the weekend, Ada continued to act under the 20-day-MA because it could not build a sustainable momentum about it. A strong closing candle would signal that ADA is ready to approach the September highs again.
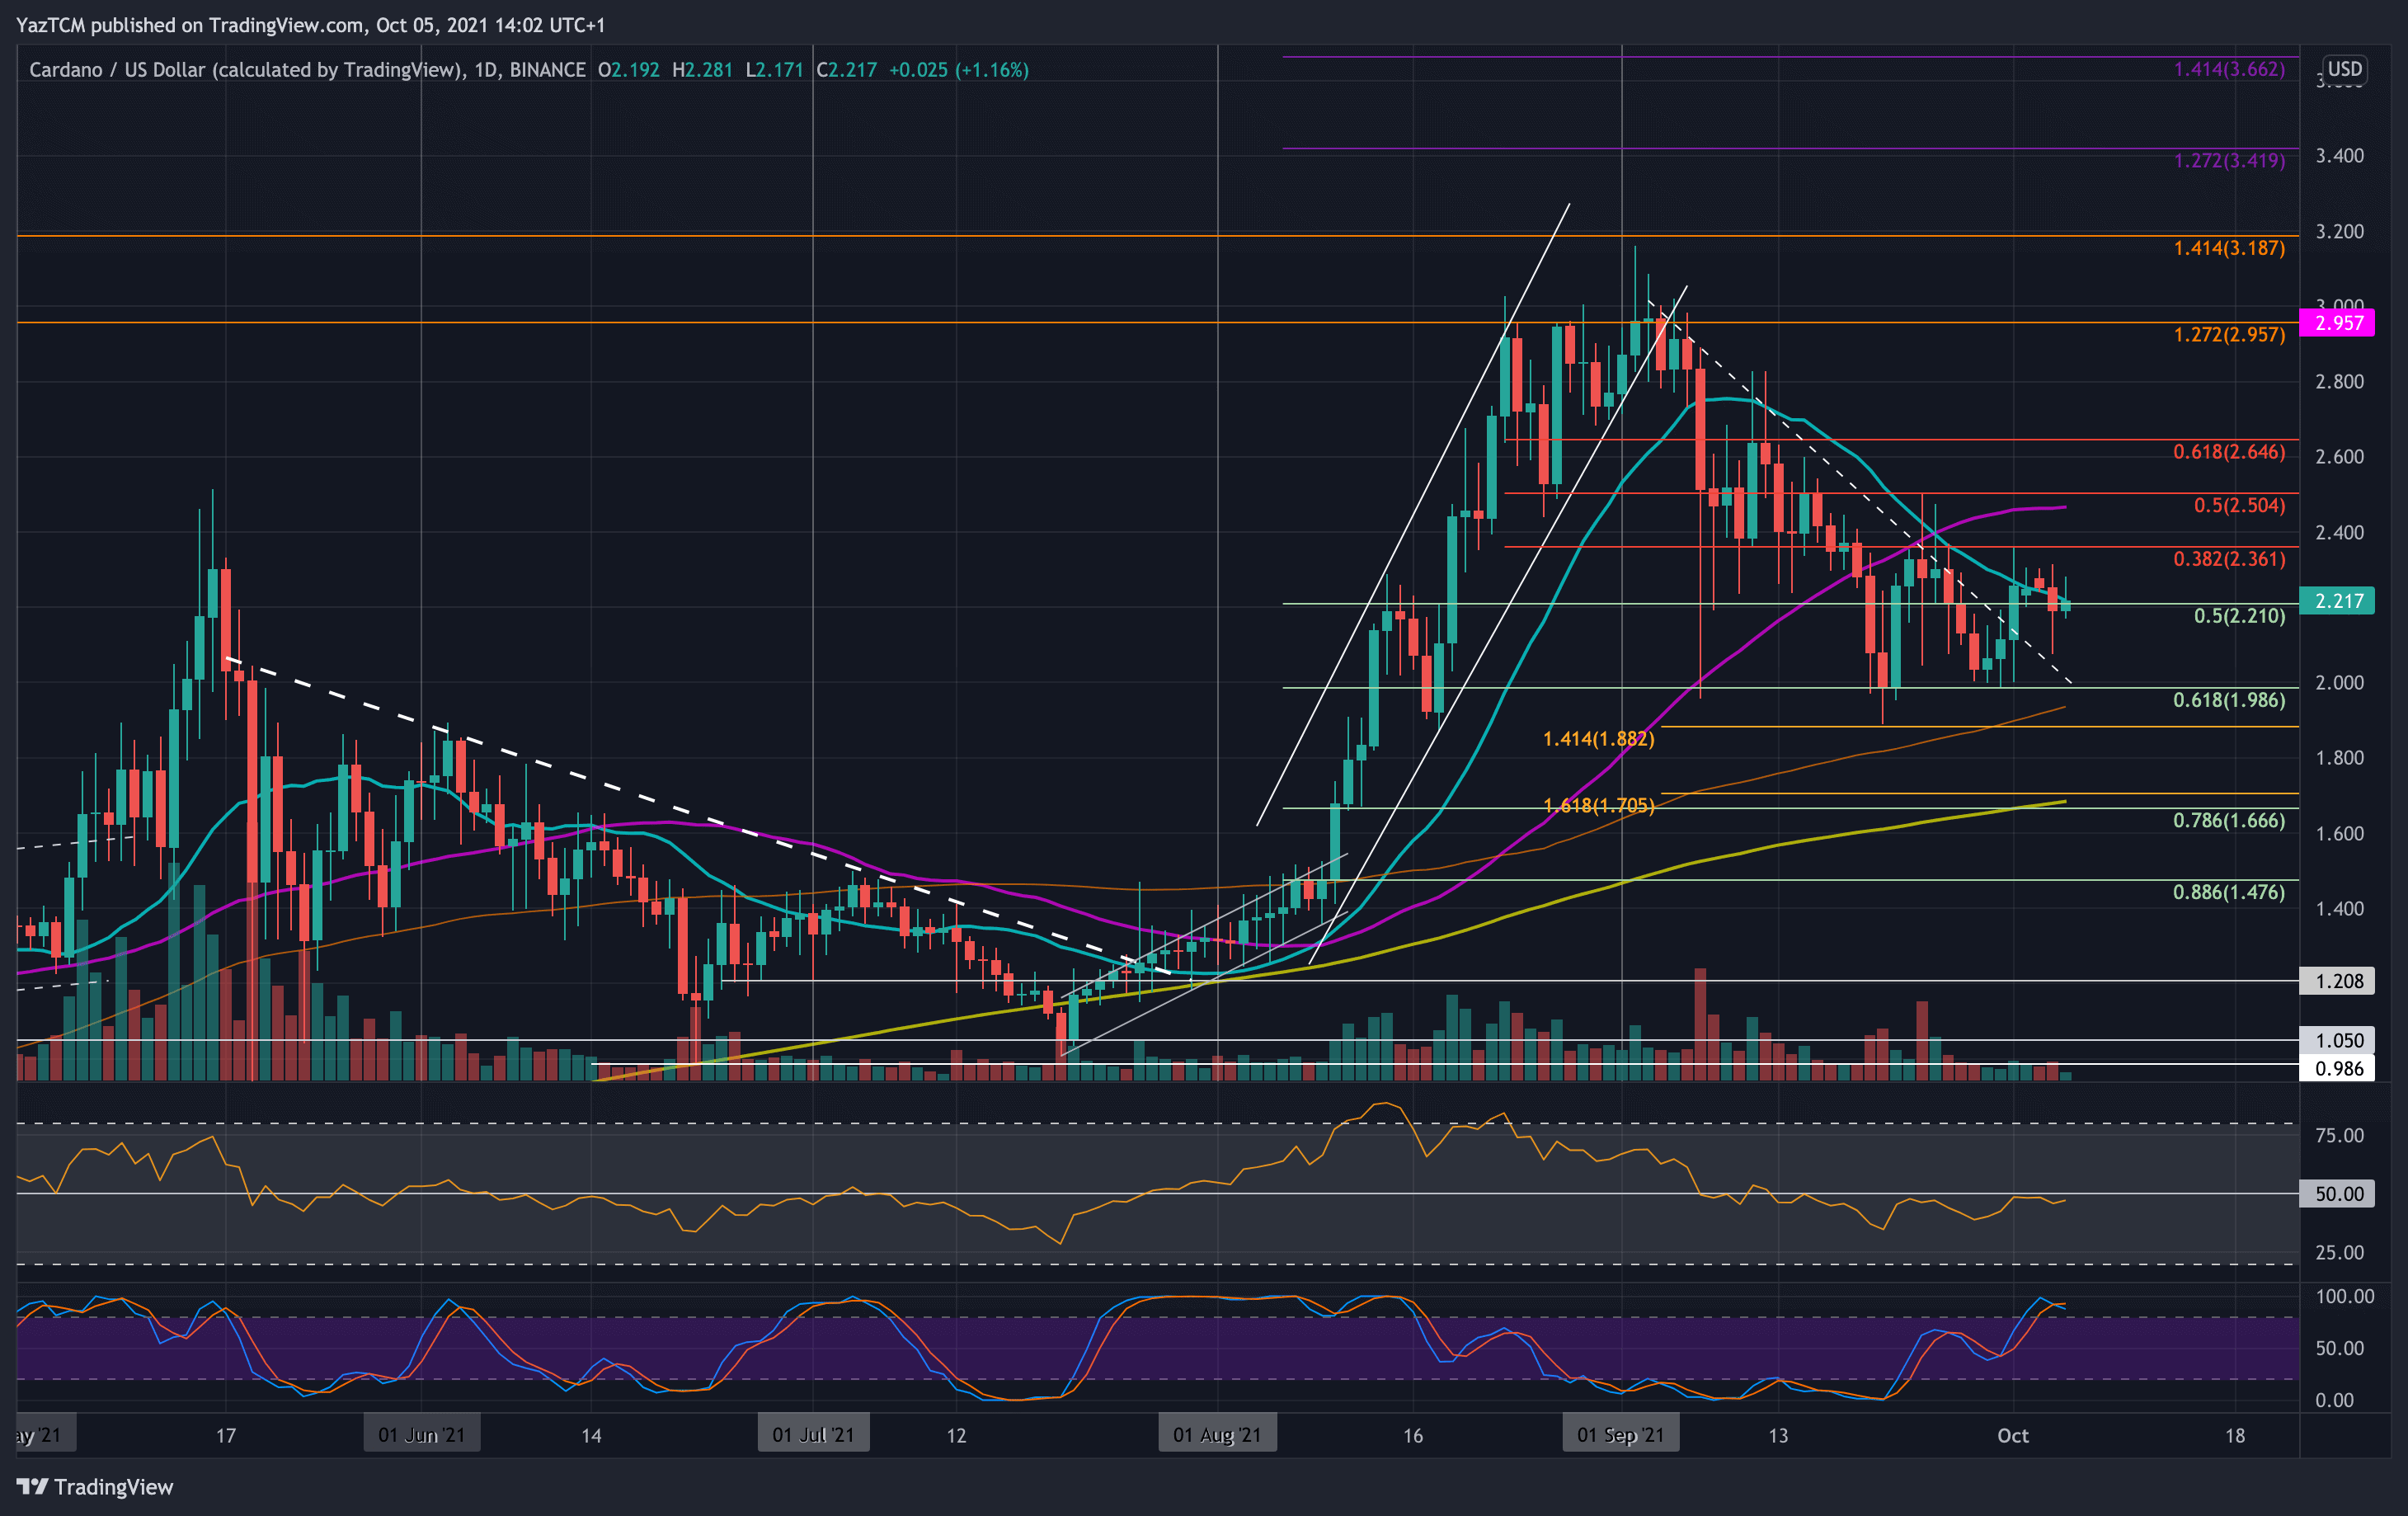
Ada-USD short-term price forecast
With a view to the future, the first resistance to the 20-day-MA is around $ 2.22. The following are $ 2.36 (Bärische 0.382 FIB), $ 2.50 (Bärische 0.5 fib & 50-day-MA) and $ 2.65 (Bärische 0.618 fib).
On the other hand, the first support is $ 2.20. USD 2.00 (0.618 fib), 1.95 USD (100-day-MA), 1.88 USD (downward trend 1.414 FIB extension) and 1.80 USD.
The daily RSI rolls under the center line, which indicates that the previous declining dynamic subsides.
ada/BTC-bears press under 0.5 fib support
Important support level: 4350 SAT, 4220 SAT, 4000 SAT.
Important resistance levels: 4500 Sat, 4700 Sat, 5000 Sat.
Ada fell under the critical support at 4700 SAT (.5 FIB), while it continued to fall below 4500 SAT and the 100-day-MA. The cryptocurrency is traded in a descending price channel since it reached the resistance at 6000 SAT in the first week of September.
Initially, Ada found support at 4800 SAT, but could not hold the level over the weekend. The lower angle of the price channel is still available for support for the forward movement.
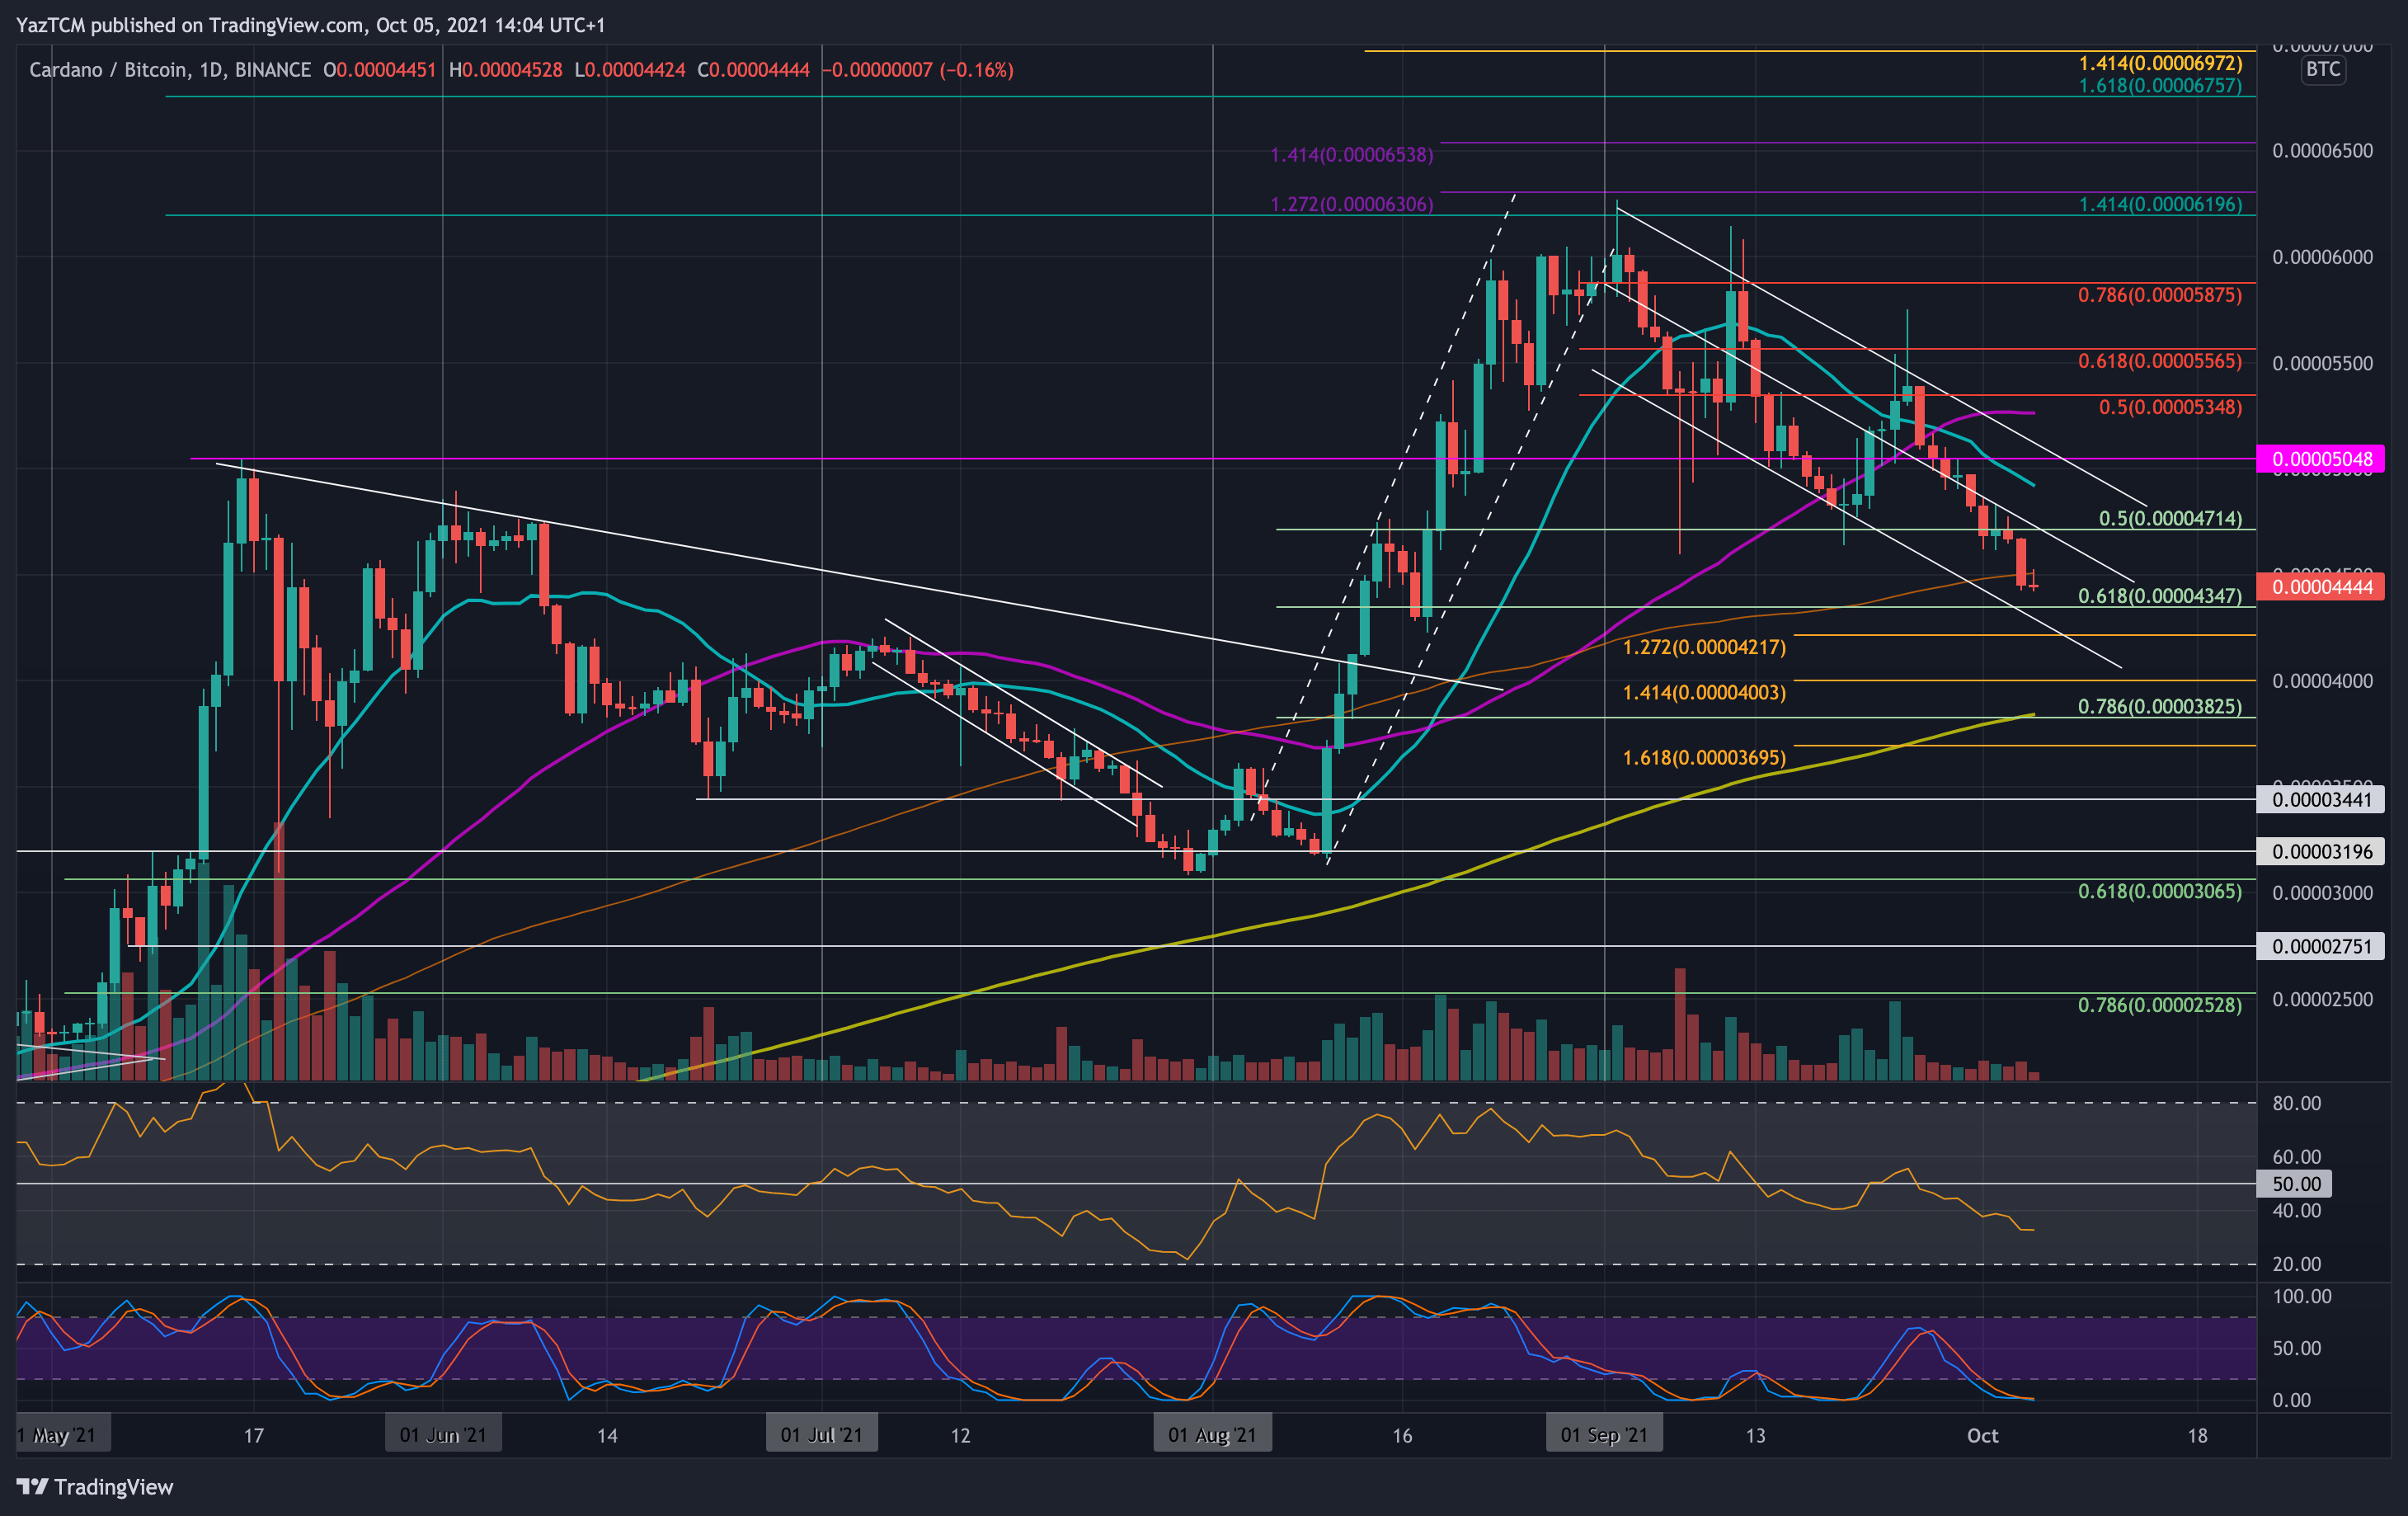
ADA-BTC short-term price forecast
With a view to the future, the first strong support is 4350 SAT (.618 FIB). 4220 SAT (below 1.272 FIB extension & lower angle of the price channel), 4000 SAT and 3825 SAT (200-day-MA).
On the other hand, the first resistance is 4500 satella. 4700 SAT, 5000 SAT and 5300 SAT (50-day-Ma).
The RSI sinks down from the center line, which indicates that the declining momentum is now increasing.
.