XRP Retreats Towards $0.5 as Sentiment Fails, Is the Rally Over? (Ripple price analysis)
Ripple's price has risen sharply in recent weeks after breaking out above the significant resistance level at $0.43. However, it may be too early for bulls to celebrate the end of the bear market as warning signs are emerging. Technical Analysis By: Edris These moving averages are also on the verge of a bullish crossover as the 50-day moving average is almost crossing the 200-day moving average to the upside. From the point of view of…

XRP Retreats Towards $0.5 as Sentiment Fails, Is the Rally Over? (Ripple price analysis)
Ripple's price has risen sharply in recent weeks after breaking out above the significant resistance level at $0.43. However, it may be too early for bulls to celebrate the end of the bear market as warning signs are emerging.
Technical analysis
From: Edris
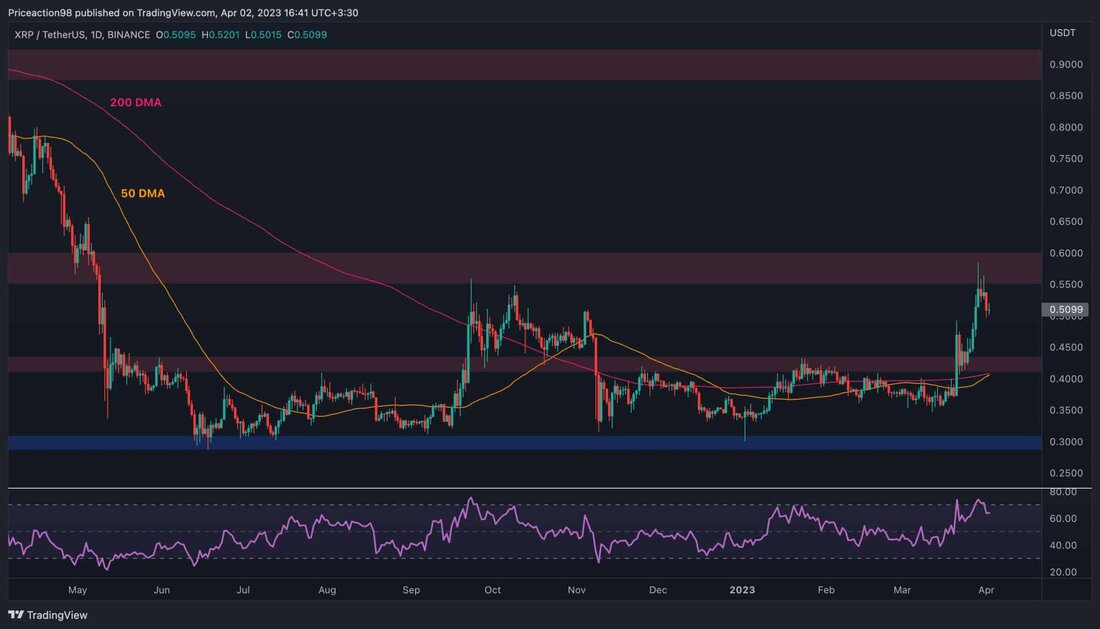
XRP/USDT daily chart:
The price has risen almost vertically in recent weeks after breaking above the $0.43 level and both the 50-day and 200-day moving averages, which are located around the $0.4 level.
These moving averages are also on the verge of a bullish crossover as the 50-day moving average is almost crossing the 200-day moving average to the upside. However, from a classic price action standpoint, things don't look so good.
The price was decisively rejected from the key resistance level at $0.55 and the RSI shows a clear bearish divergence between the last two price highs, suggesting that a correction could occur soon. In this case, the $0.43 support level would be the first potential support area.
TradingView
XRP/BTC daily chart:
Things are looking even worse against BTC as the price appears to be falling back into the broken descending channel after being impulsively rejected by the 200-day moving average around 0.00002 SAT. If the 0.000018 SAT level cannot be held, the recent breakout would be considered a fake and could cause the price to fall deeper within the channel towards the 0.000016 SAT in the short term.
On the other hand, if the market recovers from the current range, the 200-day moving average would be the first target, followed by the static resistance level at 0.000022 SAT. However, based on current price action, a pullback seems more likely in the short term.
TradingView
.

 Suche
Suche
 Mein Konto
