 Suche
Suche
 Mein Konto
XRP slips under 50-day-MA, is $ 1?

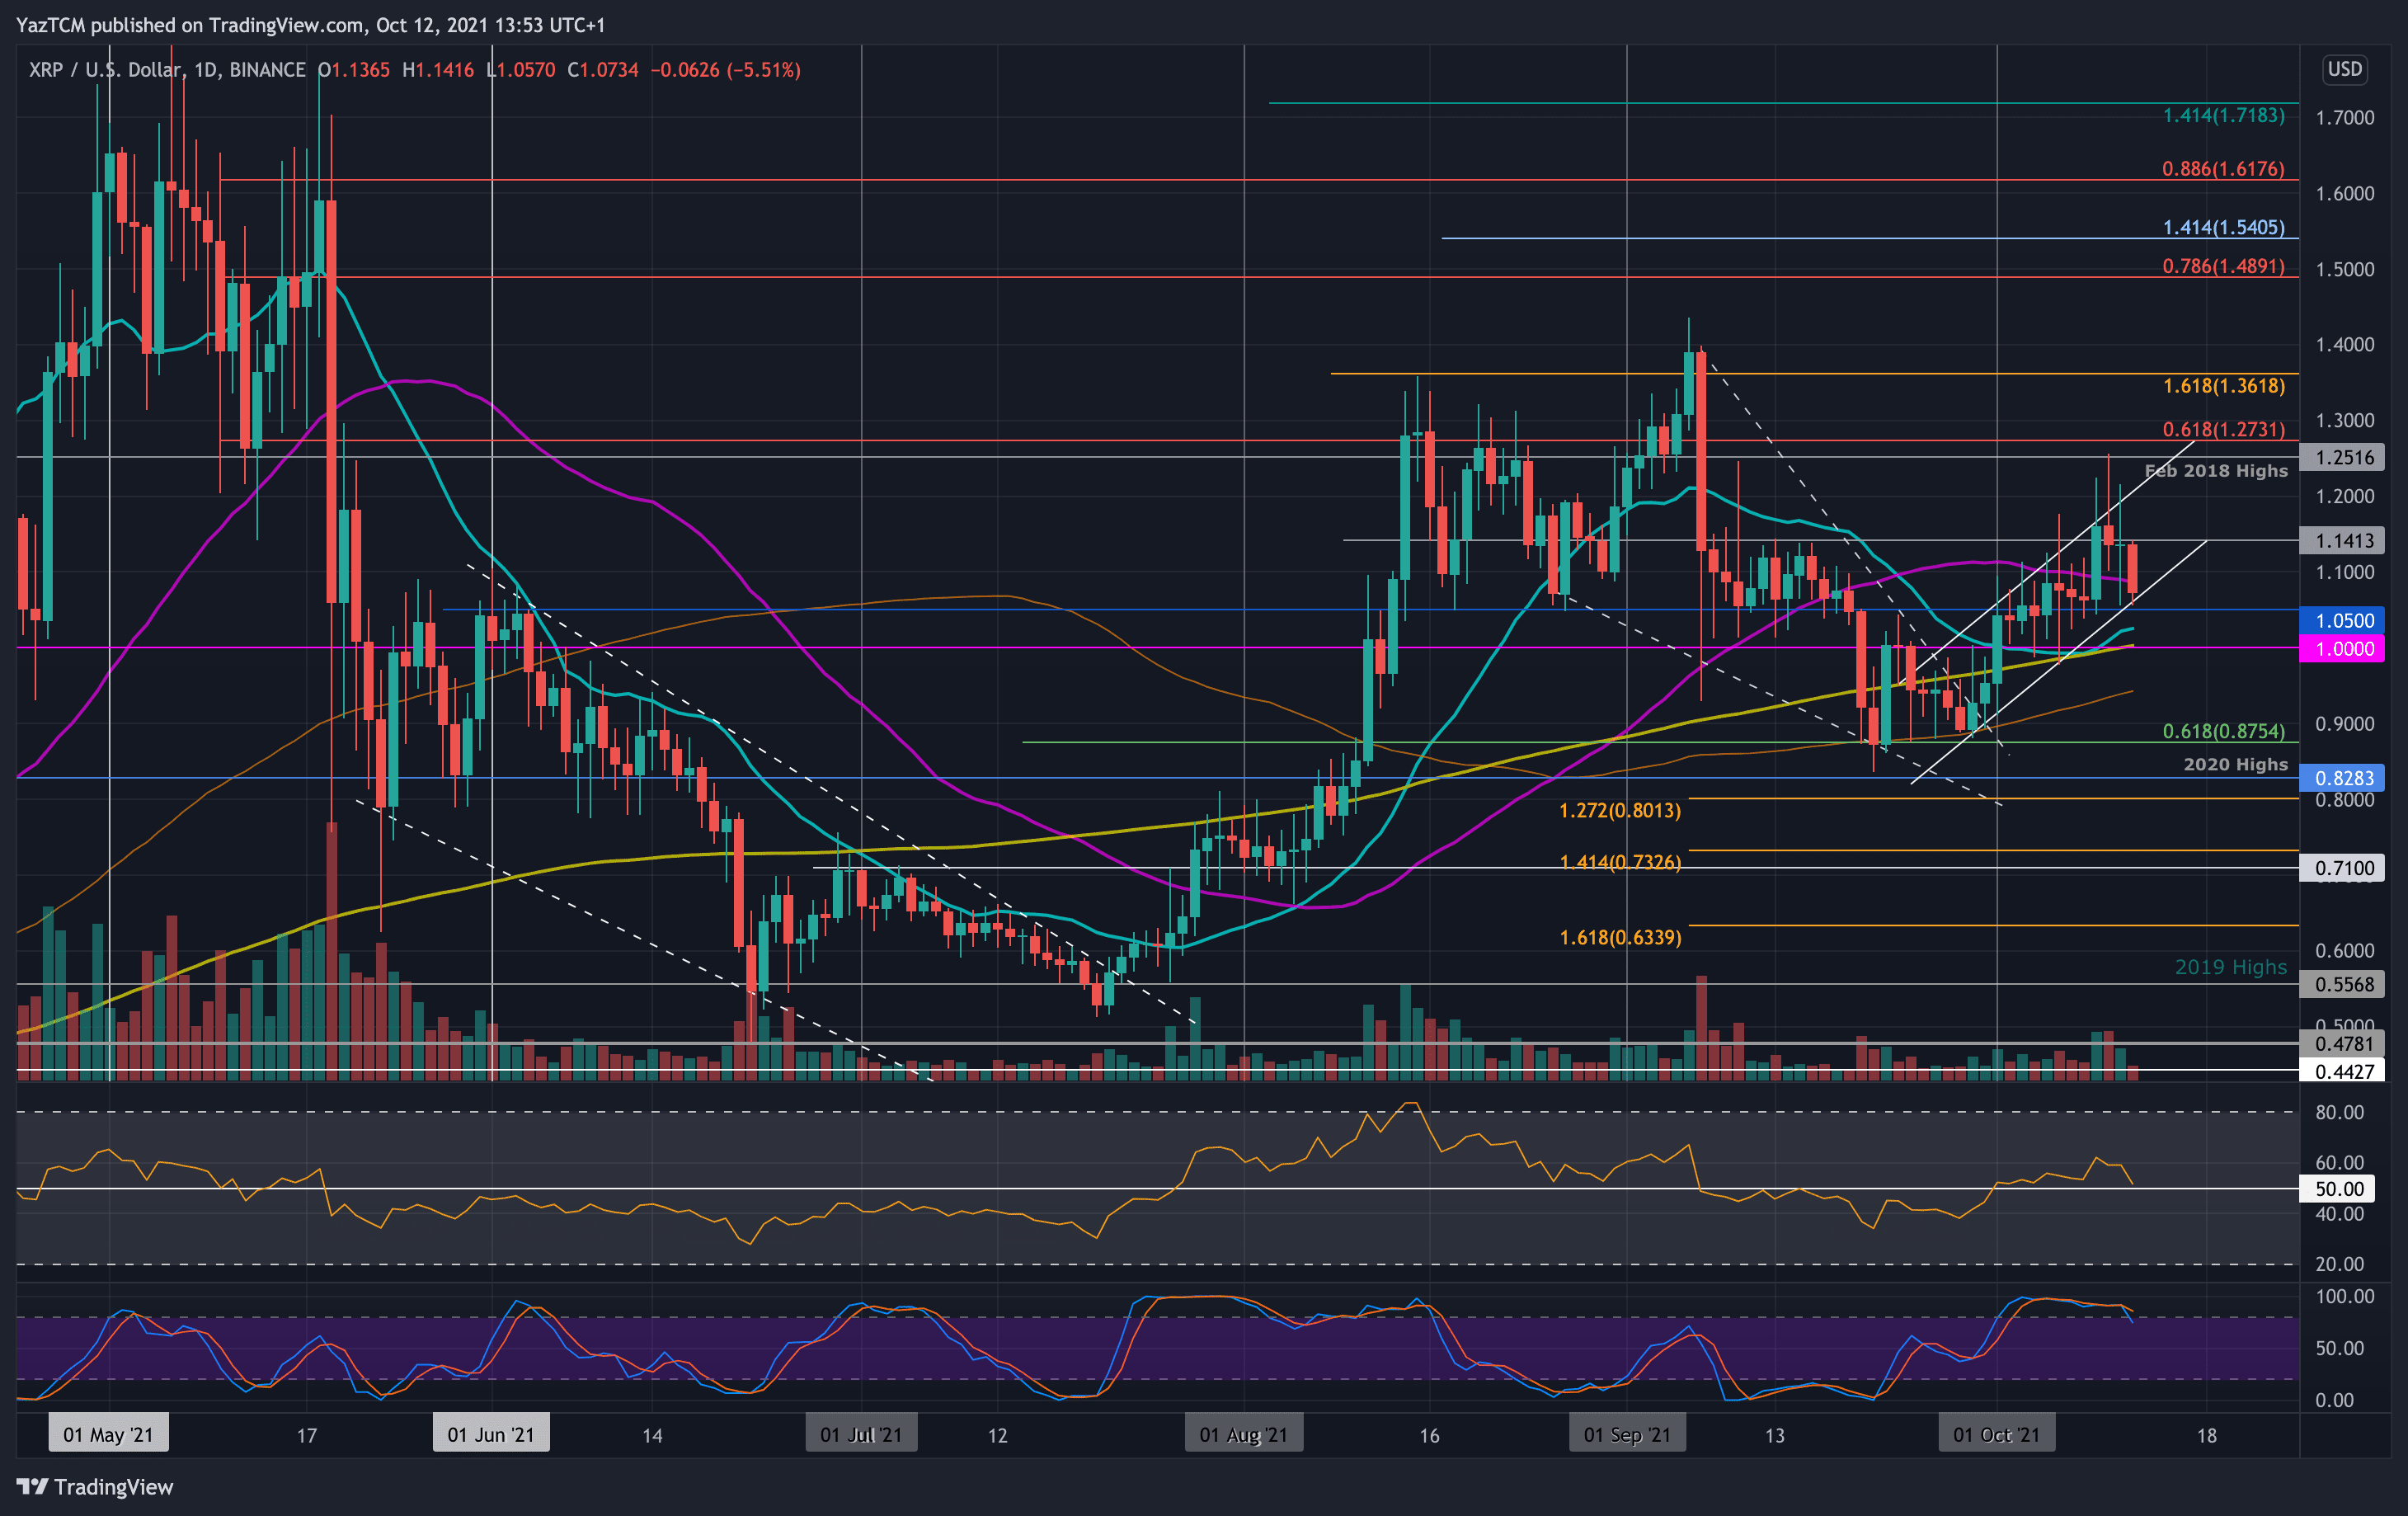
XRP/USD - XRP falls into the price channel support. Important support level: $ 1.05, $ 1.00, $ 0.95. Towards the end of September, XRP received support at $ 0.875 (0.618 FIB & 50-day-MA) and recovered from there. After that, XRP began to form a short-term rising price channel in October, which enabled it to break through the 50-day-MA at $ 1.10 and reach up to $ 1.25 (February 2018 maximum stands). Unfortunately, the bulls could not close above the upper angle of the course channel and rolled from there on Sunday. Today XRP fell of USD 1.15 to ...
XRP slips under 50-day-MA, is $ 1?
XRP/USD - XRP falls into the price channel support.
Important support level: $ 1.05, $ 1.00, 0.95 $
Important resistance levels: $ 1.1.20 $, $ 1.25
XRP received support at $ 0.875 (0.618 FIB & 50-day-MA) and recovered from there. After that, XRP began to form a short-term rising price channel in October, which enabled it to break through the 50-day MA at $ 1.10 and reach up to $ 1.25 (February 2018).
Unfortunately, the bulls could not close above the upper angle of the course channel and rolled from there on Sunday. Today XRP fell of USD 1.15 to break under the 50-day MA and to find support in the lower corner of the price channel.
XRP-USD short-term price forecast
With a view to the future, the first resistance is 1.10 USD (50-day-MA). USD 1.20 (upper angle of the price channel), 1.25 USD (high from February 2018) and USD 1.30
On the other hand, when the bears fall below the price channel, the first support is $ 1.05. USD 1.00 (200-day-MA), 0.95 USD (100-day-MA) and 0.875 USD (0.618 fib).
The daily RSI is back on the center line, which indicates indecisiveness within the market. In order to stay within the price channel, XRP would have to recover from the center line to prevent a declining dynamic from entering the market.
XRP/BTC-XRP falls under the satellite support of 2000
Important support level: 1860 Sat, 1800 Sa, 1735 Sa.
Important resistance levels: 1940 Sat, 2000 Sa, 2100
Like most old coins, XRP also suffers greatly from BTC. The coin rolled at 2700 SAT in early September and has fallen by a total of 30% since then, as it fell into a descending price channel.
in October XRP for the first time around 1940 SAT support. However, XRP fell under this support today and reached 1900 Sat. It still remains within the falling price channel.

XRP-BTC short-term price forecast
The first support is 1860 SAT (0.786 fib). This is followed by the lower angle of the price channel, 1800 SAT (July 20th) and 1735 Sat (0.886 fib).
On the other hand, the first resistance is 1940 Sat. This is followed by 2000 SAT, 2100 SAT (20-day MA0 and 2150 SAT (upper angle of the price channel).
The daily RSI remains below the center line, which shows that the bears have full control over the market dynamics.
.