Where is XRP heading next? (Ripple price analysis)
After a solid uptrend that reached a significant resistance area at $0.55, volatility increased over the past few days, resulting in rejection from the 100-day moving average and the channel's middle trendline. Currently, the XRP price is consolidating without any concrete indications of its future direction. Ripple Price Technical Analysis By Shayan The Daily Chart A closer look at the daily chart shows that XRP price experienced extreme volatility once it reached significant resistance at $0.55, which coincided with the previous major daily pivot. This resulted in a rejection and a decline towards the 100-day moving average, …

Where is XRP heading next? (Ripple price analysis)
After a solid uptrend that reached a significant resistance area at $0.55, volatility increased over the past few days, resulting in rejection from the 100-day moving average and the channel's middle trendline.
Currently, the XRP price is consolidating without any concrete indications of its future direction.
Ripple price technical analysis
By Shayan
The daily chart
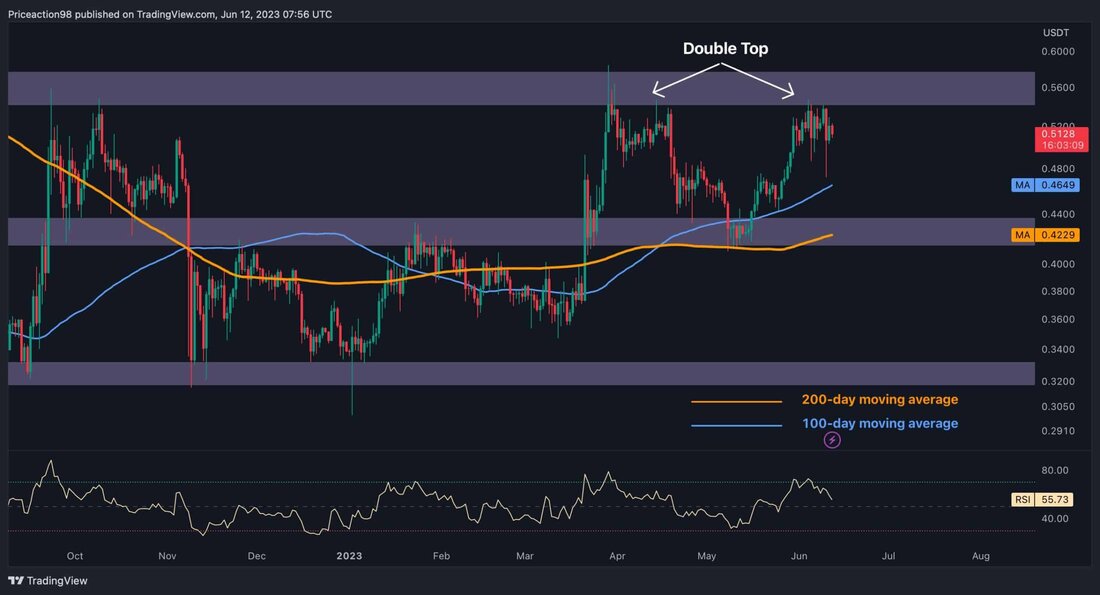
A closer look at the daily chart shows that XRP price experienced extreme volatility once it reached significant resistance at $0.55, which coincided with the previous major daily pivot.
This resulted in a rejection and a decline towards the 100-day moving average, which is around $0.47. Furthermore, a double top pattern has formed around the $0.55 area, suggesting a bearish outlook for Ripple in the short term.
Nevertheless, it seems likely that the price will consolidate within a range capped by the static resistance area of $0.55 and the dynamic support level of the 100-day moving average, currently at $0.465, until a breakout occurs in one direction or the other.
TradingVIEW
The 4 hour chart
Analyzing the 4-hour chart, XRP price fell back to the middle trendline of the ascending channel on June 5th. It then initiated an upward move to break the USD 0.55 area.
However, selling pressure in this area halted the uptrend, resulting in a significant rejection towards the middle boundary of the channel.
Ultimately, Ripple price found support for the second time at the mid-boundary, located at $0.47, and began another upward move. Nevertheless, it seems more likely that the cryptocurrency will consolidate in the area of significant resistance at $0.55 and the middle boundary of the channel in the medium term.
TradingView.

 Suche
Suche
 Mein Konto
