Here is the critical support for ETH after a weekly slump of 14 % (Ethereum price analysis)
After a longer consolidation phase without a clear direction, the cryptocurrency market has finally experienced a correction, with most of the coins lost in value. Ethereum was no exception because its price fell by 14 % and achieved a significant support zone. Technical analysis of Shayan The Ta-type Ethereum recently exceeded its previous large swing high at $ 2,000 due to its impulsive upward trend and ensured a clear upward mood by indicating a positive trend reversal. However, the price quickly formed a head and shoulder reverse pattern and was rejected, which led to a slump of 14 %. Nevertheless, the price has now reached a decisive support region that ...

Here is the critical support for ETH after a weekly slump of 14 % (Ethereum price analysis)
After a longer consolidation phase without a clear direction, the cryptocurrency market has finally received a correction, with most coins lost in value. Ethereum was no exception because its price fell by 14 % and achieved a significant support zone.
technical analysis
from Shayan
the daily -type
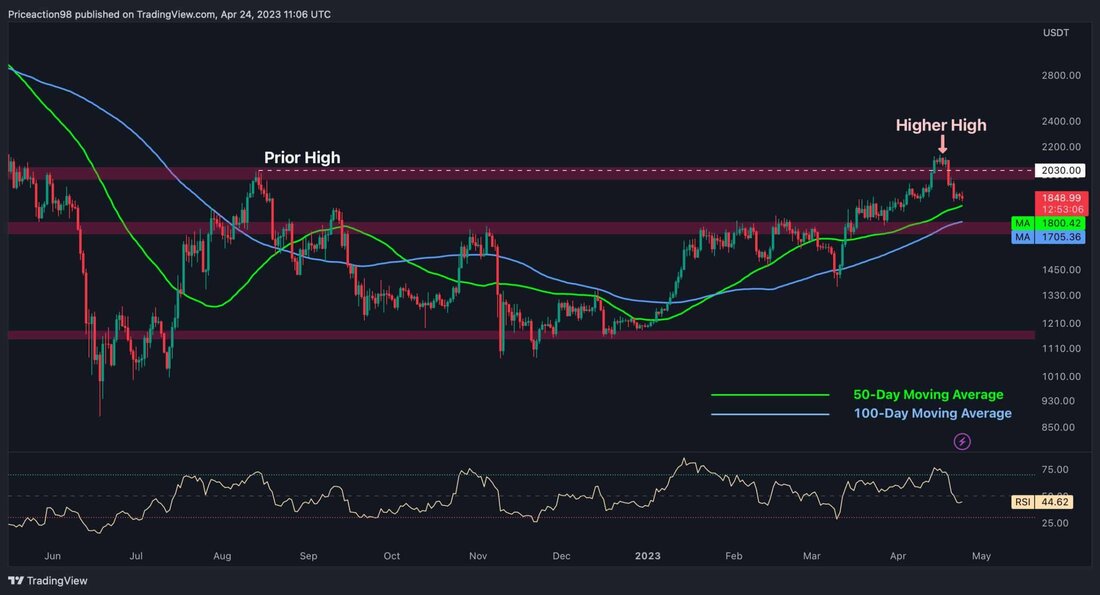
Ethereum recently exceeded its previous big swing high at $ 2,000 due to its impulsive upward trend and caused a clear upward mood by indicating a positive trend reversal. However, the price quickly formed a head and shoulder reverse pattern and was rejected, which led to a break-in of 14 %.
Nonetheless, the price has now reached a decisive support region that includes the sliding 50-day average of $ 1800 and the sliding 100-day average of $ 1705.
Therefore, the price movement within the range of $ 1.7,000 to $ 1.8,000 must be monitored, since a break from this critical support zone will probably determine the nearby direction of the future of Ethereum. If the cryptocurrency falls under this important area, your earlier big swing low will serve as primary support for the price at $ 1.4,000 in the medium term.
Tradingview
The 4-hour diagram
According to the 4-hour time frame, Ethereum's price rally ended when it tried to break out at $ 2.1,000 over the upper trend line of the channel. As a result of an impulsive decline, the price of Ethereum has now reached the mean border of the channel, a significant support/resistance region, and struggles to break it down.
If the price falls below this level, this could trigger a downward trend towards $ 1.7,000 marks. However, if the cryptocurrency finds support and reverses the downward trend, a rally towards the upper threshold is the most likely scenario for Ethereum.
Tradingview
.

 Suche
Suche
 Mein Konto
