Ethereum under pressure: Sign of a possible trend reversal despite the volatile increasing trade volume
Ethereum: Market analyzes and technical indicators in the focus. The current market situation of Ethereum (ETH) shows a significant change that carries both opportunities and risks. The drains of crypto exchanges indicate a potential accumulation that could possibly lead to an offer shock. Despite the decline in the Ethereum Prize, the increasing trading volume shows that the market activity remains high. Changes of offer and market volatility last week, according to analyst Ali Martinez, over 600,000 ETH were withdrawn from crypto exchanges. This mass extract could indicate a battery phase of the investors, which may soon have an impact on the price movements of Ethereum. At the same time, the market is characterized by volatility: ...

<p> <strong> Ethereum under pressure: Sign of a possible trend reversal despite the volatile increasing trade volume </strong> </p>
Ethereum: Market analyzes and technical indicators in focus
The current market situation of Ethereum (ETH) shows a significant change that carries both opportunities and risks. The drains of crypto exchanges indicate a potential accumulation that could possibly lead to an offer shock. Despite the decline in the Ethereum Prize, the increasing trading volume shows that the market activity remains high.
Change of offer and market volatility
According to Analyst Ali Martinez,over 600,000 ETH were withdrawn from crypto exchanges. This mass extract could indicate a battery phase of the investors, which may soon have an impact on the price movements of Ethereum.
At the same time, the market is shaped by volatility: long positions worth $ 230 million were recently liquidated, which has deterred over-indebted traders. Investors watch the level of support and resistance closely to determine the next most likely trend.
price movements and trading volume
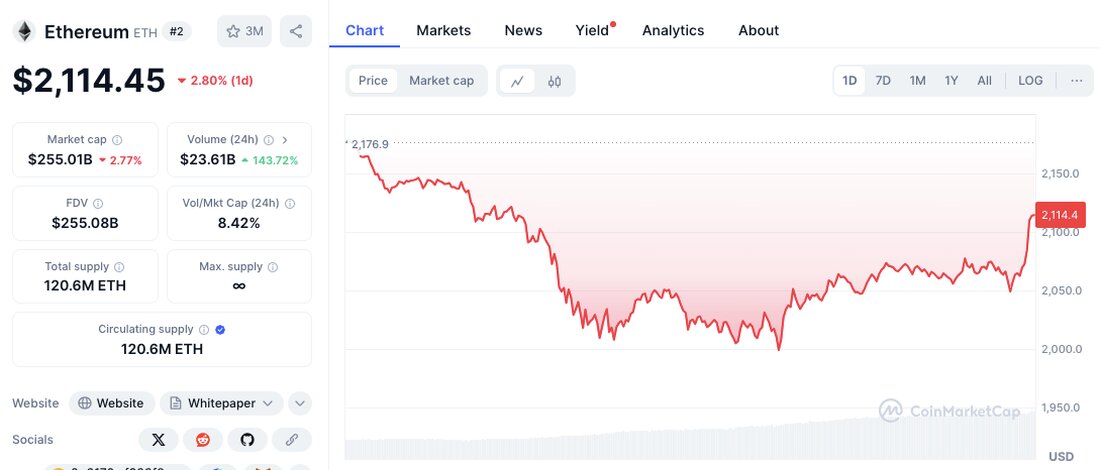
Currently Ethereum is traded at $ 2,119.85, which corresponds to a decline of 2.71 % in the last 24 hours. Although market capitalization has dropped by 2.64 %, the trading volume has increased by 136.14 %. This indicates a strong market activity because the dealers remain active despite a falling price. Such an increase in the commercial volume can increase volatility and make upcoming price movements unpredictable.
key resistances and support levels
Ethereum is against an important level of resistance at
Ethereum. This level marks the previous decline. A breakthrough could signal a trend reversal and further price gains. However, if the resistance is not overcome, this could lead to continued downward pressure.
On the underside, Ethereum has found support at around USD 2,000, a psychological brand that could be crucial. If the sales pressure increases and ETH falls below $ 2,050, the support zone at $ 1,950 would be even more important to prevent a further downward trend.
Technical indicators at a glance
Current technical indicators show mixed signals for the price development of Ethereum. The relative strength index (RSI) is 38.35, which indicates oversold conditions. A recovery could be imminent if the RSI increases over 40-45.
The Moving Average Convergence Divergence (MACD), on the other hand, shows a declining trend, whereby the MACD line remains below the signal line. Nevertheless, the MacD histogram indicates a possible weakening of the bear's momentum. If this trend continues, Ethereum could try to win back lost soil.
FAZIT
The market situation for Ethereum is currently characterized by high risks and potential opportunities. Investors should keep an eye on the crucial level of resistance and support and pay attention to the developments in the technical indicators in order to be able to make informed decisions.

 Suche
Suche
 Mein Konto
