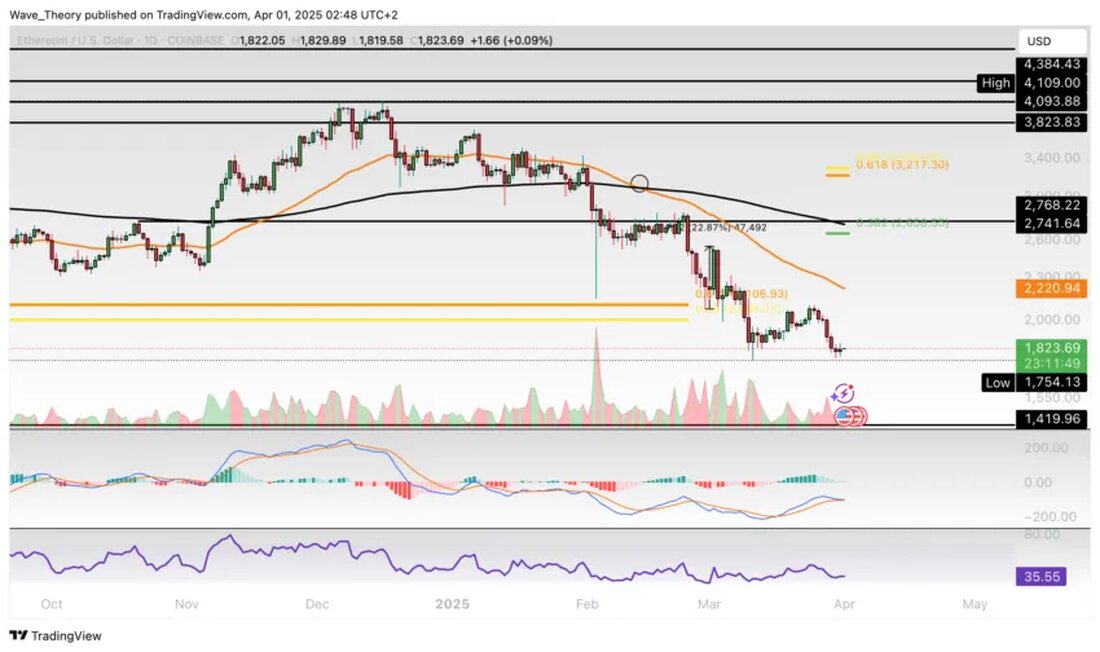
Ethereum on downward path: break of the golden ratio support signals the bear market and possible return to the 1,105 USD brand
Ethereum forecast for April 1, 2025: Bear trend after breaking the Golden Ratio Support of the Ethereum course recently broke the Golden Ratio support, which disabled the bull trend dynamics. This indicates that Ethereum may have started a new bear cycle that could drop the course considerably. Correction to around 1.105 USD? The indicators show a clear bears of the bear in the daily type. The exponential moving average (EMAS) have formed a death cross, which is a bearish confirmation for the short -term to medium -term trend. The MacD lines are about to cross a bearish crossing, and the histogram of the MacD also points down. ...

<p> <strong> Ethereum on downward path: break of the golden ratio support signals the bear market and possible return to the 1,105 USD brand </strong> </p>
Ethereum forecast for April 1, 2025: Bear trend after breaking the Golden Ratio Support
The Ethereum course recently broke the Golden Ratio support, which dismeased the bull trend dynamics. This indicates that Ethereum may have started a new bear cycle that could drop the course considerably.
correction to around $ 1,105?
In the daily type, the indicators show a clear bear. The exponential moving average (EMAS) have formed a death cross, which is a bearish confirmation for the short -term to medium -term trend. The MacD lines are about to cross a bearish crossing, and the histogram of the MacD also points down. The relative strength index (RSI), on the other hand, remains in the neutral area, without clear bullish or bear signals.
If Ethereum continues, the RSI could possibly form a bullish divergence and thus initiate a potential upward movement up to about $ 2,221 or $ 2,742. These levels correspond to the resistance of the 50-dayemaema or the 200-dayema.
Mixed signals in the 4-hour chart
In the 4-hour chart there is also a death cross, which indicates a short-term bear trend. Contrary to this bearish tendency, the MacD lines crossed Bullish, and the histogram of the MacD tends upwards. The RSI remains neutral.
downward movement in the weekly chart
The break of the Golden Ratio level by $ 2,100 is to be considered strongly bears and has negated the bull trend, so that Ethereum is now anchored in a downward trend. The course could return to the support zone between $ 1,105 and $ 1,420. Here, too, the MacD lines are crossed in a bear, while the histogram ticks Bullish and the RSI is in the oversold areas. In order to return to the bullish area, Ethereum would have to overcome the next Fibonacci resistors at around $ 2,660 and $ 3,250. At around $ 2,750, the 50-week MEMA acts as an additional resistance.

Bärischer MacD in the Monthly Charter
In the monkey type, the histogram of the MacD has been tending downwards for four months, and the MacD lines show a bearish crossing. The RSI shows itself neutral. Should Ethereum initiate an upward movement, the significant resistance on the 50-monthema is around $ 2,215
support against Bitcoin
Compared to Bitcoin, Ethereum has reached the support zone between around 0.01615 BTC and 0.02275 BTC. In this area, the course could stabilize and initiate a potential upward movement. The next significant fibonacci resistors are waiting at around 0.0372 BTC and 0.0463 BTC. The indicators in the month of the month give mixed signals: the MACD lines are over-crossed, while the RSI linger in oversold regions and the histogram of the MacD begins to rise bullishly.
Against this background, Ethereum against BTC could soon show a positive price development.
Overall, the current market signals show that Ethereum is in a critical phase in which both bear and bullish developments are possible. Investors should observe the situation carefully.

 Suche
Suche
 Mein Konto
