ETH at Critical Support, Breakdown May Quickly Lead to $1200
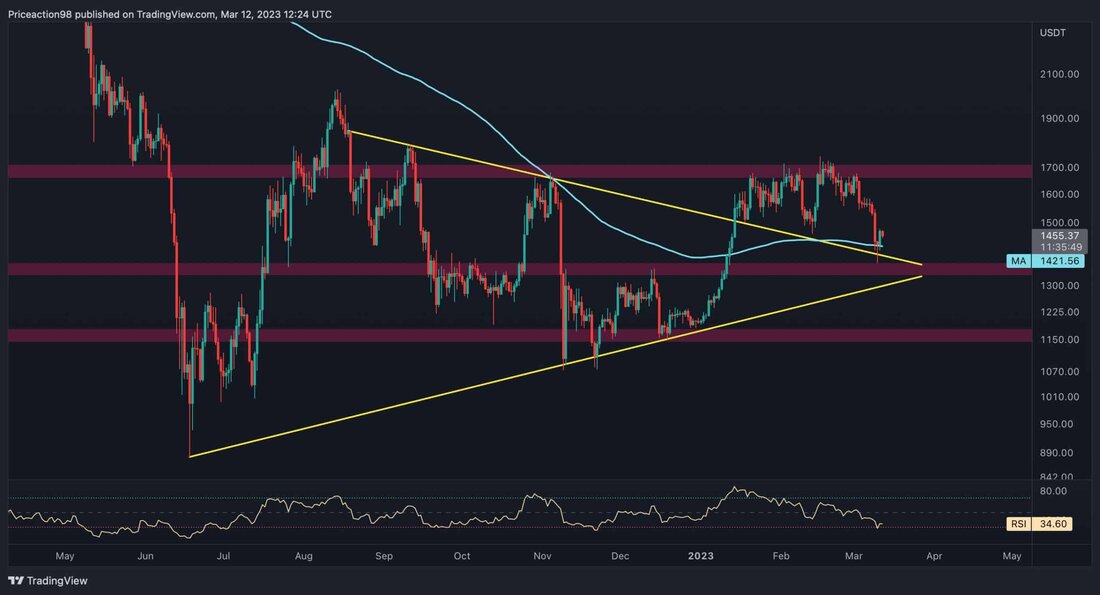
Despite the ongoing bearish sentiment among market participants following the recent turmoil at SVB Bank and its impact on USDC, the price of Ethereum has found significant support in the $1450 price range. The coming days will be crucial to see whether ETH can maintain the critical level or continue its negative sentiment. Technical Analysis By Shayan The Daily Chart After breaking the upper trendline of the symmetrical triangle and consolidating for an extended period, Ethereum price has declined and is currently retesting the previous breakout level at $1450. If ETH...

ETH at Critical Support, Breakdown May Quickly Lead to $1200
Despite the ongoing bearish sentiment among market participants following the recent turmoil at SVB Bank and its impact on USDC, the price of Ethereum has found significant support in the $1450 price range.
The coming days will be crucial to see whether ETH can maintain the critical level or continue its negative sentiment.
Technical analysis
From Shayan
The daily chart
After breaking the upper trendline of the symmetrical triangle and consolidating for an extended period, Ethereum price has declined and is currently retesting the previous breakout level at $1450.
If ETH holds this level, traders can expect another bullish leg towards the crucial resistance level at $1700,000.
However, if the price breaks below the trendline, a plunge towards the $1.2K support level could be imminent. Nevertheless, the triangle's upper trendline aligns with the 200-day moving average at $1450 and provides a solid support level.
The 4 hour chart
The price of ETH follows an ascending price channel (as shown below). However, it recently fell below the middle equilibrium line, leading to a cascade. Nevertheless, the price has now reached the lower boundary of the channel and is finding temporary support.
The price is “stuck” in a narrow range between the lower threshold at around $1,410 and the static resistance region at $1,500. ETH is likely to break out of this range in the coming days, and the direction of the breakout will determine the direction of ETH's next short-term price.
From Shayan
The Taker Buy/Sell Ratio is an indicator that helps understand market sentiment by showing whether there is more buying or selling activity.
During ETH's recent bull phase, we observed an increase in this metric, confirming positive market sentiment. However, when the price entered a consolidation phase and then declined significantly, the metric fell below one, indicating a changea strong bearish sentiment.
As a result, the metric fell to a new multi-month low, suggesting that the market is unlikely to enter a bull phase unless the metric reaches a value above one.
.

 Suche
Suche
 Mein Konto
