The volume of Bitcoin is scattered by $ 22.4,000, but does a massive movement come? (BTC price analysis)
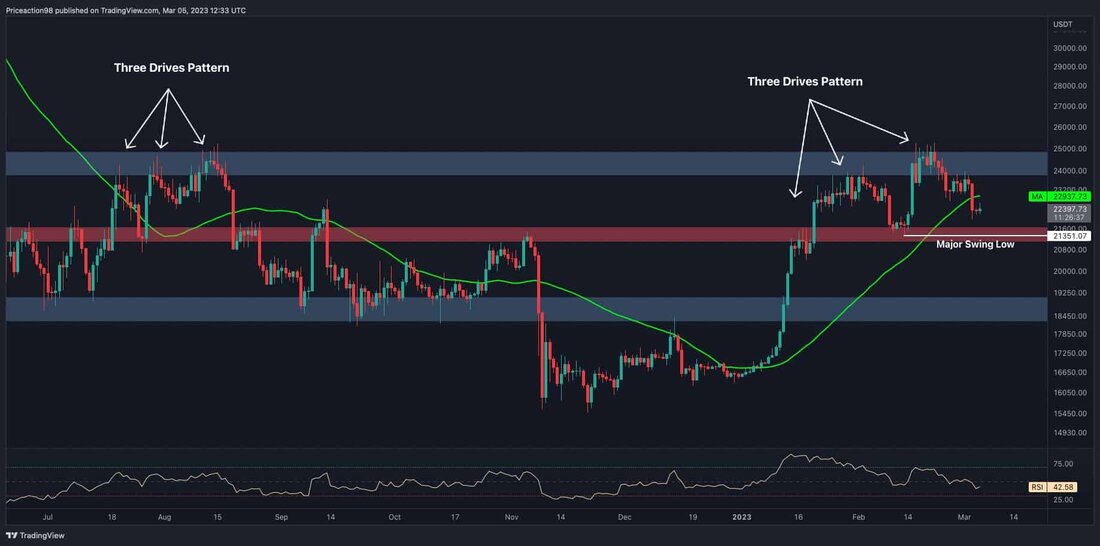
After a short phase of bullish price movements and an impulsive upward rally, Bitcoin entered a consolidation phase with little momentum. Although it was rejected from a decisive level of resistance, the price shows declining signs. Technical analysis by Shayan The Ta-Ghart The level of resistance of $ 25,000 was a nightmare for Bitcoin investors last year, since the price could not rise beyond this point and was constantly rejected. Days ago the cryptocurrency tried to exceed this decisive level and experienced a significant decline. In the resistance region of $ 25,000, the price has formed an ascending three-drive pattern, a well-known declining reverse pattern. The same ...

The volume of Bitcoin is scattered by $ 22.4,000, but does a massive movement come? (BTC price analysis)
After a short phase of bullish price movements and an impulsive upward rally, Bitcoin entered a consolidation phase with little momentum. Although it was rejected from a decisive level of resistance, the price shows declining signs.
technical analysis
of Shayan
the daily -type
The level of resistance of $ 25,000 was a nightmare for Bitcoin investors last year, since the price could not rise beyond this point and was constantly rejected. Days ago the cryptocurrency tried to exceed this decisive level and experienced a significant decline.
The price has formed an ascending three-drive pattern in the resistance region of $ 25,000, a well-known declining reverse pattern. The same pattern can be seen in August when BTC tried to overcome this strong resistance, which led to a massive rejection and an impulsive decline.
Bitcoin has also fallen below the sliding 50-day average, which leads to a general declining tendency for cryptocurrency. If the slump continues and Bitcoin falls under its previous big momentum, a declining rally in the direction of the critical support of $ 18,000 is more likely.
Tradingview
The 4-hour diagram
During the consolidation phase of the market, Bitcoin has formed an ascending trend line that supports the price. The latest fud by Silvergate and Binance has led to a significant decline and pressed the cryptocurrency towards the rising trend line.
At the moment, BTC is fighting to break the trend line at $ 22.4,000 and consolidates itself with extremely low volatility.
If the trend line is broken, Bitcoin could experience market cleanup in the medium term and rinse many long positions on the appointment market. The level of support in the regions of $ 21.5,000 and $ 18,000
Tradingview
on-chain analysis
As with any other market, the price of Bitcoin is also determined by offer and zerady dynamics. If the demand exceeds the supply, the price increases and vice
The Exchange Netflow metric for all stable coins could be helpful to measure the possible demand for buying Bitcoin. When the metric reaches top values, this can be interpreted so that the participants deposit stable coins, possibly for the purpose of buying bitcoin.
recently the metric climbed and became significantly green, which indicates that a considerable number of stable coins was deposited on the stock exchanges.
Although the participants should consider every scenario to control their risks, the recent increase in metrics may indicate that the players are ready to add sufficient demand to the market and to drive up the prices at the right time.
Cryptoquant
.

 Suche
Suche
 Mein Konto
