BTC rises to $ 31,000, but is a correction imminent? (Bitcoin price analysis)
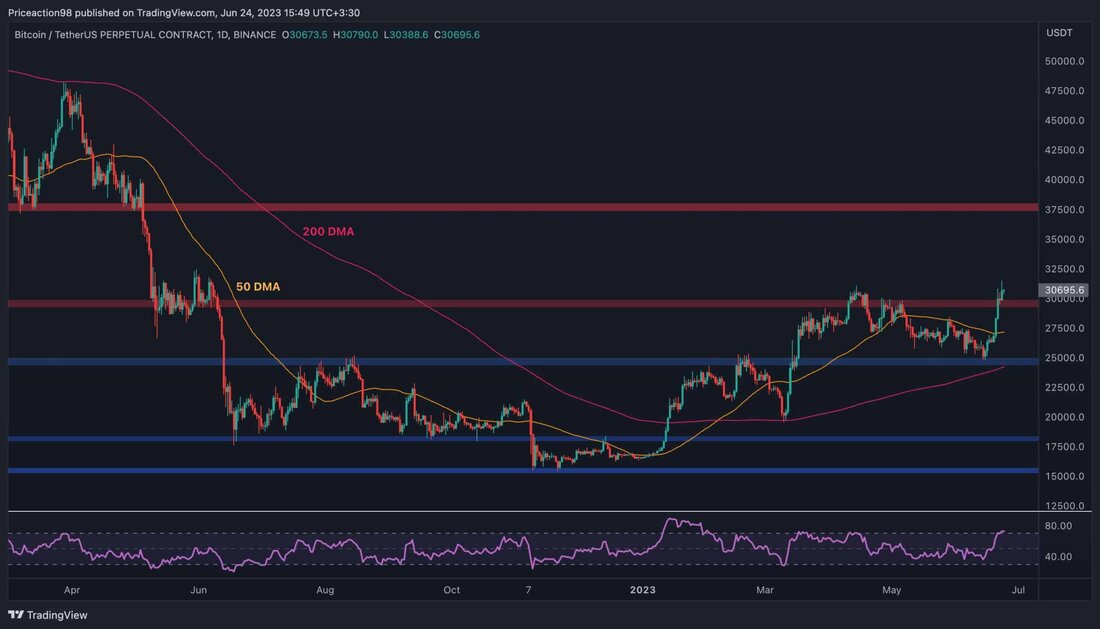
After a longer consolidation phase, the Bitcoin Prize has successfully overcome the critical resistance brand of $ 30,000. However, it is important to exercise caution on the market, especially at short notice. Technical analysis of: EDRIS The daily chart in the daily time frame, the Bitcoin Prize experienced a quick upward movement last week after it had greatly recovered from the support brand of $ 25,000. The resistance at $ 30,000 was exceeded and the price was tried to keep its position over it. However, the RSI indicator is currently signaling an overbought state, which suggests a likely correction. In this case, the sliding 50-day average could be the level of support at 27,500 ...

BTC rises to $ 31,000, but is a correction imminent? (Bitcoin price analysis)
After a longer consolidation phase, the Bitcoin Prize has successfully overcome the critical resistance brand of $ 30,000. However, it is important to exercise caution on the market, especially at short notice.
technical analysis
by: edris
The daily chart
In the daily time frame, the Bitcoin Prize experienced a quick upward movement last week after it had greatly recovered from the support brand of $ 25,000. The resistance at $ 30,000 was exceeded and the price tried to keep its position over it.
However, the RSI indicator is currently signaling an overbought state, which suggests a likely correction. In this case, the sliding 50-day average could act as a level of support by $ 27,500, followed by the sliding 200-day average near the $ 25,000 area.
Tradingview
The 4-hour diagram
The 4-hour time frame reflects a scenario similar to the daily chart, with a strong upward movement and a breakthrough of resistance levels. The latest rally started after the outbreak from the descending channel and drove the price to higher maximum stalls over $ 30,000.
Nevertheless, caution is advised, since the RSI indicator has a significant declining divergence. This indicates the possibility of soon consolidation or correction and causes investors to remain vigilant.
Tradingview
on-chain-analysis
Bitcoin long -term holder sopr
After Bitcoin's latest rally, many owners who had suffered losses for several months can now sell and make profits.
The SOPR metric for long-term owners, which is shown in the diagram together with a sliding 100-day average, indicates the ratio of profits or losses achieved by long-term institutions. Values over 1 indicate profit treatment, values under 1 to losses.
The graphic clearly shows that long -term owners who had suffered losses for almost a year have now started selling profit due to the recent price increase. Although this situation is not necessarily harmful, it could increase the supply of Bitcoin and may lead to a subsequent drop in price without sufficient demand.
TradingView.

 Suche
Suche
