BTC consolidated under $ 29,000, but is that the calm before the storm? (Bitcoin price analysis)
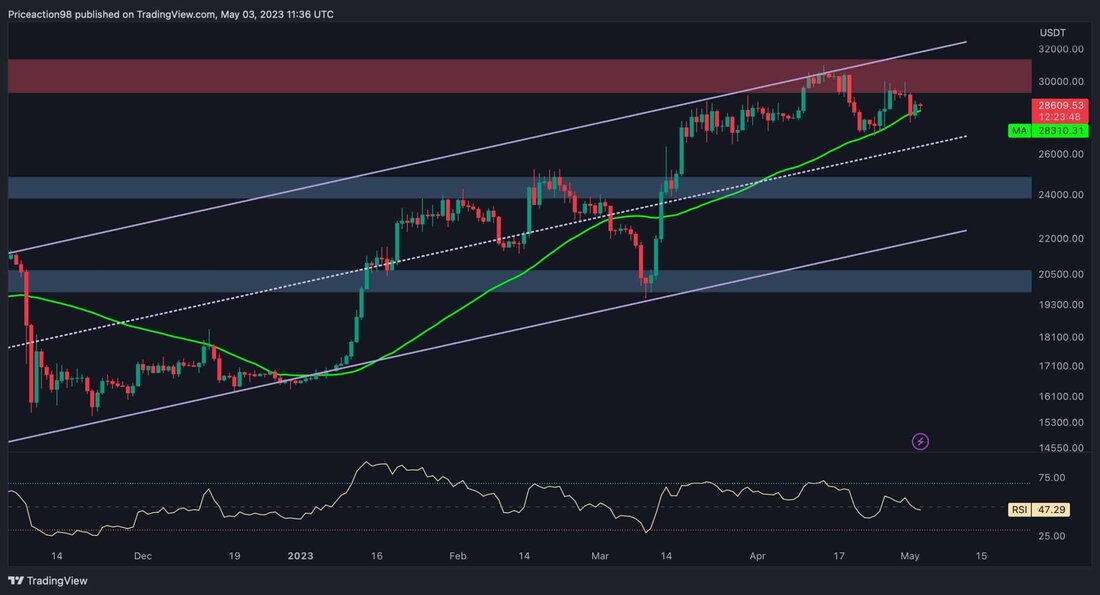
The price of Bitcoin consolidated between the sliding 50-day average $ 28,310 and the resistance region of $ 30,000. However, it seems likely that it breaks out of this decisive range and determines the direction of its upcoming rally. From Shayan the daily-type after the course with the sliding 50-day average of around $ 27,000 supported, a steady upward trend with the aim of surpassing the $ 30,000 region for the second time. However, Bitcoin could not exceed this decisive resistance zone, which led to a slight decline. Nevertheless, the BTC Prize currently consolidates $ 28,000 ...

BTC consolidated under $ 29,000, but is that the calm before the storm? (Bitcoin price analysis)
The price of Bitcoin consolidated between the sliding 50-day average $ 28,310 and the resistance region of $ 30,000. However, it seems likely that it breaks out of this decisive range and determines the direction of its upcoming rally.
from Shayan
the daily -type
After the course had found support with the sliding 50-day average of around $ 27,000, a steady upward trend with the aim of surpassing the $ 30,000 region for the second time. However, Bitcoin could not exceed this decisive resistance zone, which led to a slight decline.
Nevertheless, the BTC Prize currently consolidates within the narrow span of the sliding 50-day average $ 28,000 and $ 30,000
A breakout over the $ 30,000 region will have a significant impact on the market mood, as this is a decisive psychological resistance. Conversely, a decline under the sliding 50-day average can lead to volatility and consolidation in lower price ranges.
Tradingview
The 4-hour diagram
If you look at the 4-hour time frame, it is obvious that the price in a static range of $ 30,000 and $ 27,000 got stuck. BTC recently had a high volatility, which led to large red and green candles without a clear sign of the general market orientation.
Ultimately, Bitcoin's price will probably break out of this range in the coming weeks, and the direction of the following trend of cryptocurrency will depend heavily on the direction of the outbreak. However, since the RSI indicator is on the 50 mark, which indicates a state of balance between bulls and bears, BTC is expected that a consolidation phase is going through in addition to volatility.
Tradingview
from: edris
The price of Bitcoin has increased since he recovered from the $ 16,000 mark a few months ago, which gives many investors hope that the bear market has finally over and a new upward phase started. Miner, however, seem to be much more pessimistic.
This diagram shows the metric of the miners' position index (MPI), which indicates the ratio of the entire miner outflow to its sliding one-year average of the entire miner outflow. High values indicate mass sales by the miners who are one of the most critical cohorts on the market.
The MPI has risen lately lately and has shown its highest values since January 2021, which indicates that the miners sold their coins with a significant rate near the latest highs. This could be seen as a declining signal, and if the sales pressure continues, it could lead to a reversal and continuation of the bear market at short notice.
Cryptoquant
.

 Suche
Suche
 Mein Konto
