Bitcoin Slips Below $23,000, But a Bullish Indicator Flashes (BTC Price Analysis)
Bitcoin's price rally has stalled as the market has been consolidating below significant resistance levels for weeks. While there are some concerning short-term technical signs, a very bullish signal is also developing. Technical Analysis By: Edris The Daily Chart On the daily time frame, the price has recently been consolidating below the $25,000 resistance area. The recent daily candles suggest that the bullish momentum is fading. The RSI also confirms this as it has fallen below the 70% level, indicating that the market has entered a pullback phase. However, the 50-day moving average is about to...

Bitcoin Slips Below $23,000, But a Bullish Indicator Flashes (BTC Price Analysis)
Bitcoin's price rally has stalled as the market has been consolidating below significant resistance levels for weeks. While there are some concerning short-term technical signs, a very bullish signal is also developing.
Technical analysis
From: Edris
The daily chart
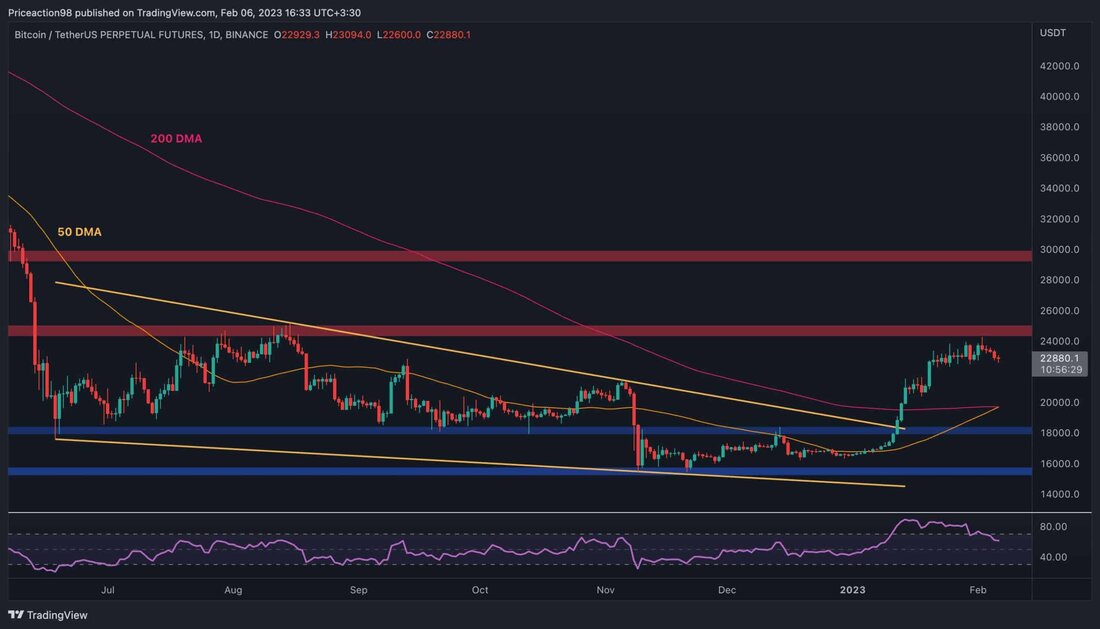
On the daily time frame, the price has recently been consolidating below the $25,000 resistance area. The recent daily candles suggest that the bullish momentum is fading. The RSI also confirms this as it has fallen below the 70% level, indicating that the market has entered a pullback phase.
However, the 50-day moving average is about to cross the 200-day moving average up around the $20,000 level, which is known to be a very bullish signal in the medium term.
Therefore, although a short-term pullback seems imminent, the market could soon recover and break above the $25,000 level.
TradingView
The 4 hour chart
On the 4-hour chart, the price is yet to break out of the tight range between the $24,000 and $22,500 levels. Currently, the lower boundary of this range is being tested and could eventually break it to the downside, which could cause the market to fall towards the $21,000 area in the short term.
The RSI indicator has shown a clear bearish divergence over the past few days. However, it now also indicates the dominance of sellers, as this oscillator shows values below the 50% threshold.
In conclusion, a bearish breakdown of $22,500 seems very likely at the moment as a deeper pullback appears imminent.
TradingView
On-chain analysis
Bitcoin funding rates
After the recent price increase, investors are becoming optimistic about Bitcoin again. The futures market is showing a positive sentiment signal, but there are also some worrying signs.
The chart below shows the funding rate metric, which indicates whether market sentiment for perpetual futures is bullish or bearish. Values above 0 are associated with bullish sentiment, while values below 0 indicate bearish sentiment.
This metric has shown positive values in recent weeks, suggesting that investors are optimistic and have been buying more aggressively in the futures market. However, during the recent consolidation, the funding rate metric has maintained positive values, with the price not increasing.
This could be a negative signal if things do not change as it could mean that selling pressure has increased and a price drop could lead to another significant long liquidation cascade, which would likely cause a price crash in the short term.
CryptoQuant
.

 Suche
Suche
 Mein Konto
