Bear market finally over? (Bitcoin price analysis)
Bear market finally over? (Bitcoin price analysis)
After a long period of uncertainty, the price of Bitcoin finally managed to break through a critical technical resistance level.
This has caused some investors to ask themselves whether the bear market is finally over or whether this recent rally is just a bull trap, a temporary increase in the course.
technical analysis
of Shayan
the daily -type
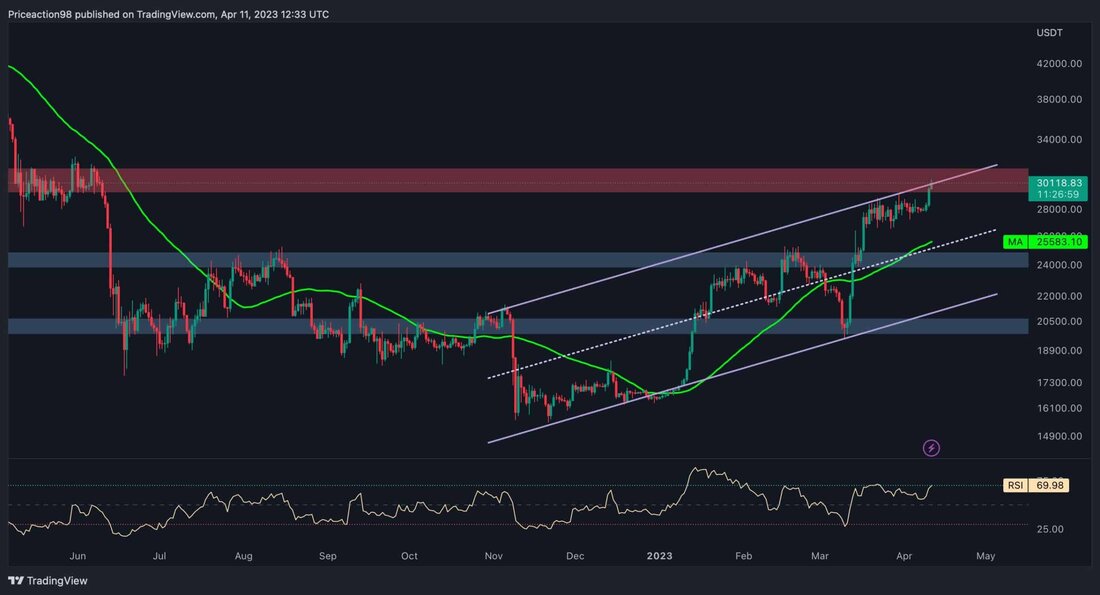
Bitcoin has achieved an important and decisive resistance range of $ 30,000, which brings back upwards on the market. Now that the price has exceeded this static sentimental level, many participants believe that the bear market is over and that Bitcoin has found its low point at $ 15,000.
However, it is still premature to explain this latest upward trend as the beginning of the next bull market, since the price exceeds the upper trend line of the rising channel and then tests it again in the form of a retreat.If the price is and falls from this important region, the $ 25,000 range will serve as the strongest support, since it is also aligned with the gliding 50-day average.
The 4-hour diagram
Bitcoin recently experienced a significant increase, broke the upper threshold of a consolidation correction wedge pattern and printed remarkable green candles during the 4-hour period.
If the price manages to stay above the resistance region of $ 30,000 and successfully test it again as a pullback, there is potential for an extensive upward movement in the direction of the $ 38,000 region.
However, there is currently a significant divergence between the course and the RSI indicator, which increases the probability of a short-term slump.
The RSI indicator has entered the overbought area, which indicates that a short-term correction is required for the next healthy house-punch rally.
Tradingview
on-chain analysis
The price of Bitcoin has made a significant movement by broken through a critical technical resistance level. However, this price increase could only be a temporary increase, which is known as a bull trap.
To get an insight that could happen next, it is worth looking at the behavior of Bitcoin miners. By investigating their reserves, it becomes clear that you have used the recent price increase to sell some of your stocks to cover your operating costs.
This index was in a slight downward trend last month, which indicates that the miners sold their coins with increasing speed, and there are no signs that this trend will slow down in the foreseeable future.
If this continues to sell, there is an increased risk of declining reversal at short notice, since the market is flooded with an oversupply. This could lead to the prices falling again because the demand has difficulty keeping up with the influx of coins sold by miners.
It will therefore be important to keep an eye on the behavior of the miners to determine the direction that Bitcoin's price could soon take.
Cryptoquant
.


Kommentare (0)