XRP slips away from $ 0.60, is a deeper correction imminent? (Ripple price analysis)
XRP slips away from $ 0.60, is a deeper correction imminent? (Ripple price analysis)
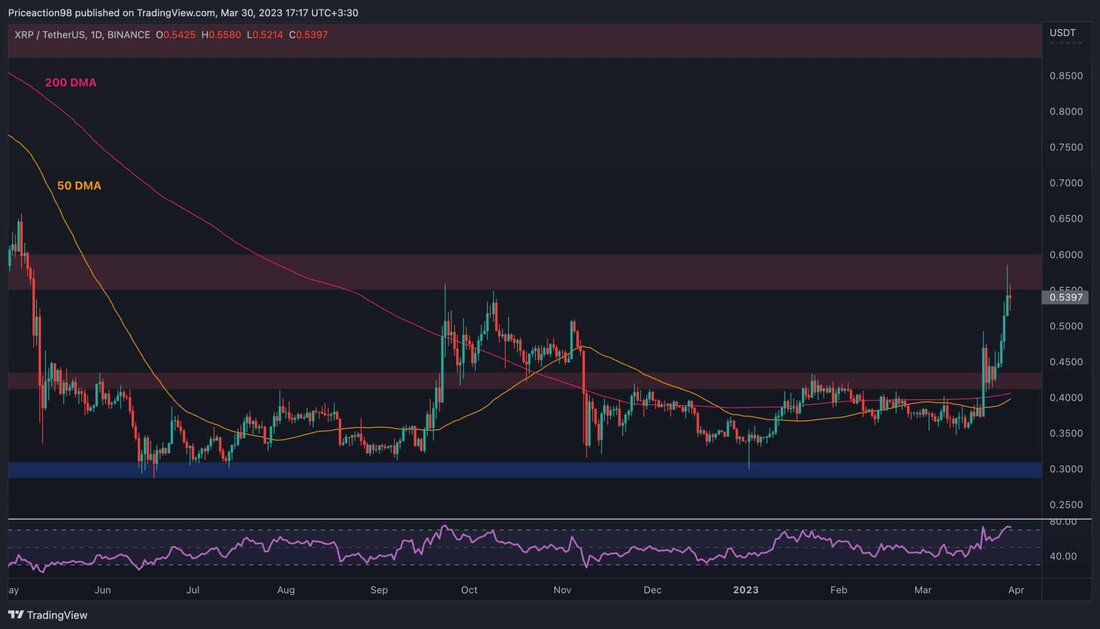
rippleder Price of has recovered violently in the past few days and has broken several significant level of resistance against both USDT and BTC. However, the price is currently fighting at a key level.
technical analysis
from: Edris
XRP/USDT-TACTART:
The price of XRP has risen quickly since he broke up the $ 0.43 mark and tested again. Ripple is currently traded at around $ 0.54 per piece and has finally reached the important resistance area of $ 0.55. However, the price seems to be struggling to break through this level, and a short -term withdrawal or even a reversal could be expected.
The RSI indicator also shows a clear overbought signal, which increases the likelihood of declining rejection of the current level. In the event of a deep correction, the $ 0.43 mark can now be counted as support.
Tradingview
XRP/BTC daily diagram:
compared to BTC, the price movement is pretty similar, with an almost vertical increase last week. The resistance values of 0.000016 SAT and 0.000018 SAT as well as the sliding 50-day average, which is located around the range of 0.0000165 SAT, were all broken up with considerable strength.
The price has also climbed over the upper limit of the large rising channel, but is now testing it again after the important gliding 200-day average has been rejected around the 0.00002 satellite area.
If the trend line holds, the sliding 200-day average could be tested and broken at short notice, and a rally in the direction of the satellite resistance brand of 0.000022 would be more likely.
On the other hand, a decline within the channel could be disappointing for the householders, since the fake outbreak would probably follow a deep correction in the direction of the satellite level of 0.000016.
Tradingview
.


Kommentare (0)