XRP fights for $ 0.4, but does a crash come? (Ripple price analysis)
XRP fights for $ 0.4, but does a crash come? (Ripple price analysis)
rippledie price action of was anything but convincing lately, since the cryptocurrency has been rejected by an important level of resistance to the USD. XRP is also in a downward trend on the paired BTC chart, which makes things worse.
technical analysis
from: Edris
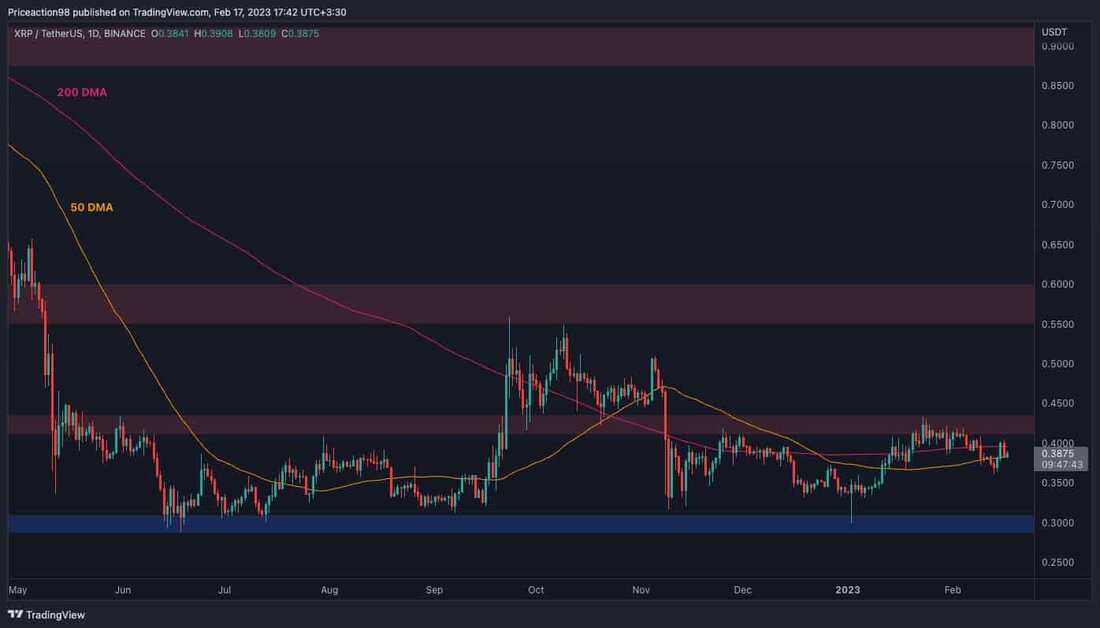
XRP/USDT-TACTART:
In the daily time frame of the XRPusdt charts, the price was rejected several times from the $ 0.43 brand and is currently fluctuating between the sliding 200-day and 50-day average, which are around $ 0.395 or $ 0.385.
If the sliding 50-day average is broken down, a decline in the direction of the important level of support of $ 0.3 would be more likely. On the other hand, if the price succeeds in breaking the range of $ 0.43, an increase in the direction of the resistance mark of $ 0.55 would be likely.
Tradingview
XRP/BTC daily diagram:
Opposite Bitcoin has been in free fall, since it broke down and tested the satellite level of 0.000018 down and tested again without returning up. At the moment, the satellite support level of 0.000015 seems to be the most likely goal.
The RSI indicator, however, shows an oversized signal because the oscillator fell below the 30 mark. This signal could indicate a potential interest bully sweater or consolidation before it leads to a further continuation of the deep.
Tradingview
.


Kommentare (0)