XRP explodes by 9 %weekly, but is a correction imminent? (Ripple price analysis)
XRP explodes by 9 %weekly, but is a correction imminent? (Ripple price analysis)
Rippleder Price shows a little upward trend after 4 weeks down movement. However, there are still some worrying signs in the charts.
technical analysis
from: Edris
XRP/USDT-TART
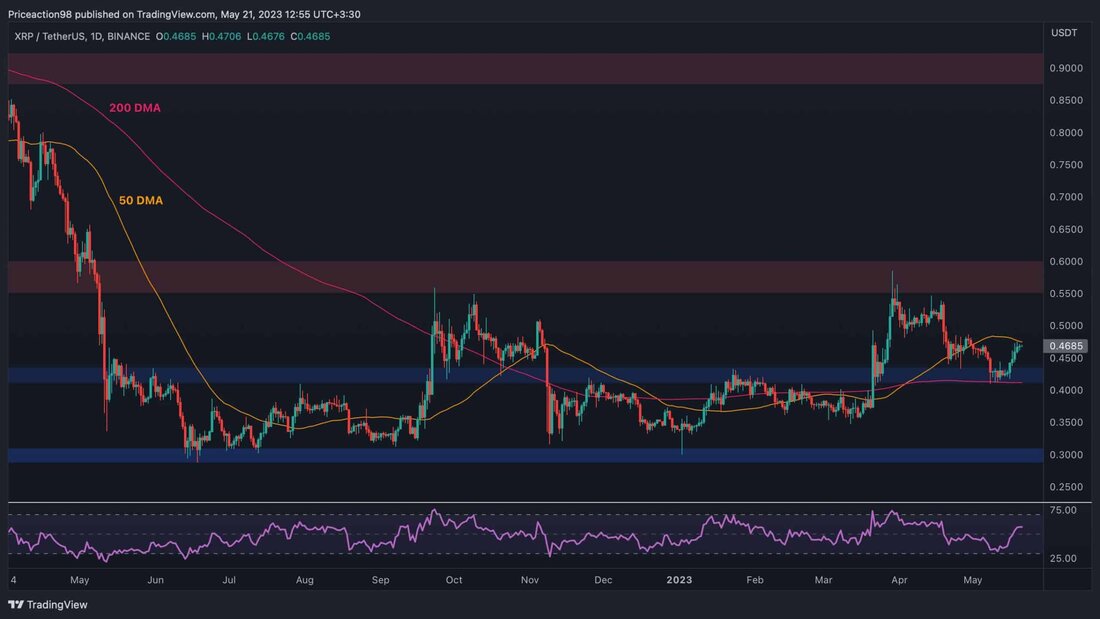
The price has recovered from the level of support of $ 0.43, with the important gliding 200-day average lying at about the same level. The sliding 50-day average is currently being tested around $ 0.47, but XRP has to break it.
If an interest bully outbreak should occur, a recovery towards the level of resistance of $ 0.6 would be the most likely scenario. On the other hand, a decline under the sliding 200-day average would be catastrophic, since a decline in the direction of the $ 0.3 mark and even more likely. This would probably extend the bear market.
The RSI indicator has also increased to over 50 % and is currently showing a bullish momentum.
Tradingview
XRP/BTC-Ta-type
compared to BTC, XRP has finally broken out of the large downward channel after more than 6 months. The price has increased over the sliding 50-day average around the mark of 0.000017 and is currently attacking the resistance mark of 0.000018.
The sliding 200-day average, which tends to the price of 0.000019, could be the next goal if the price breaks through the 0.000018 mark. On the other hand, a decline could lead to a crash in the direction of the 0.000013 mark.
to judge the momentum signal of the RSI, a bullish scenario appears more likely.
Tradingview
.


Kommentare (0)