 Suche
Suche
XRP breaks through the range of last week and lasts over 1. $

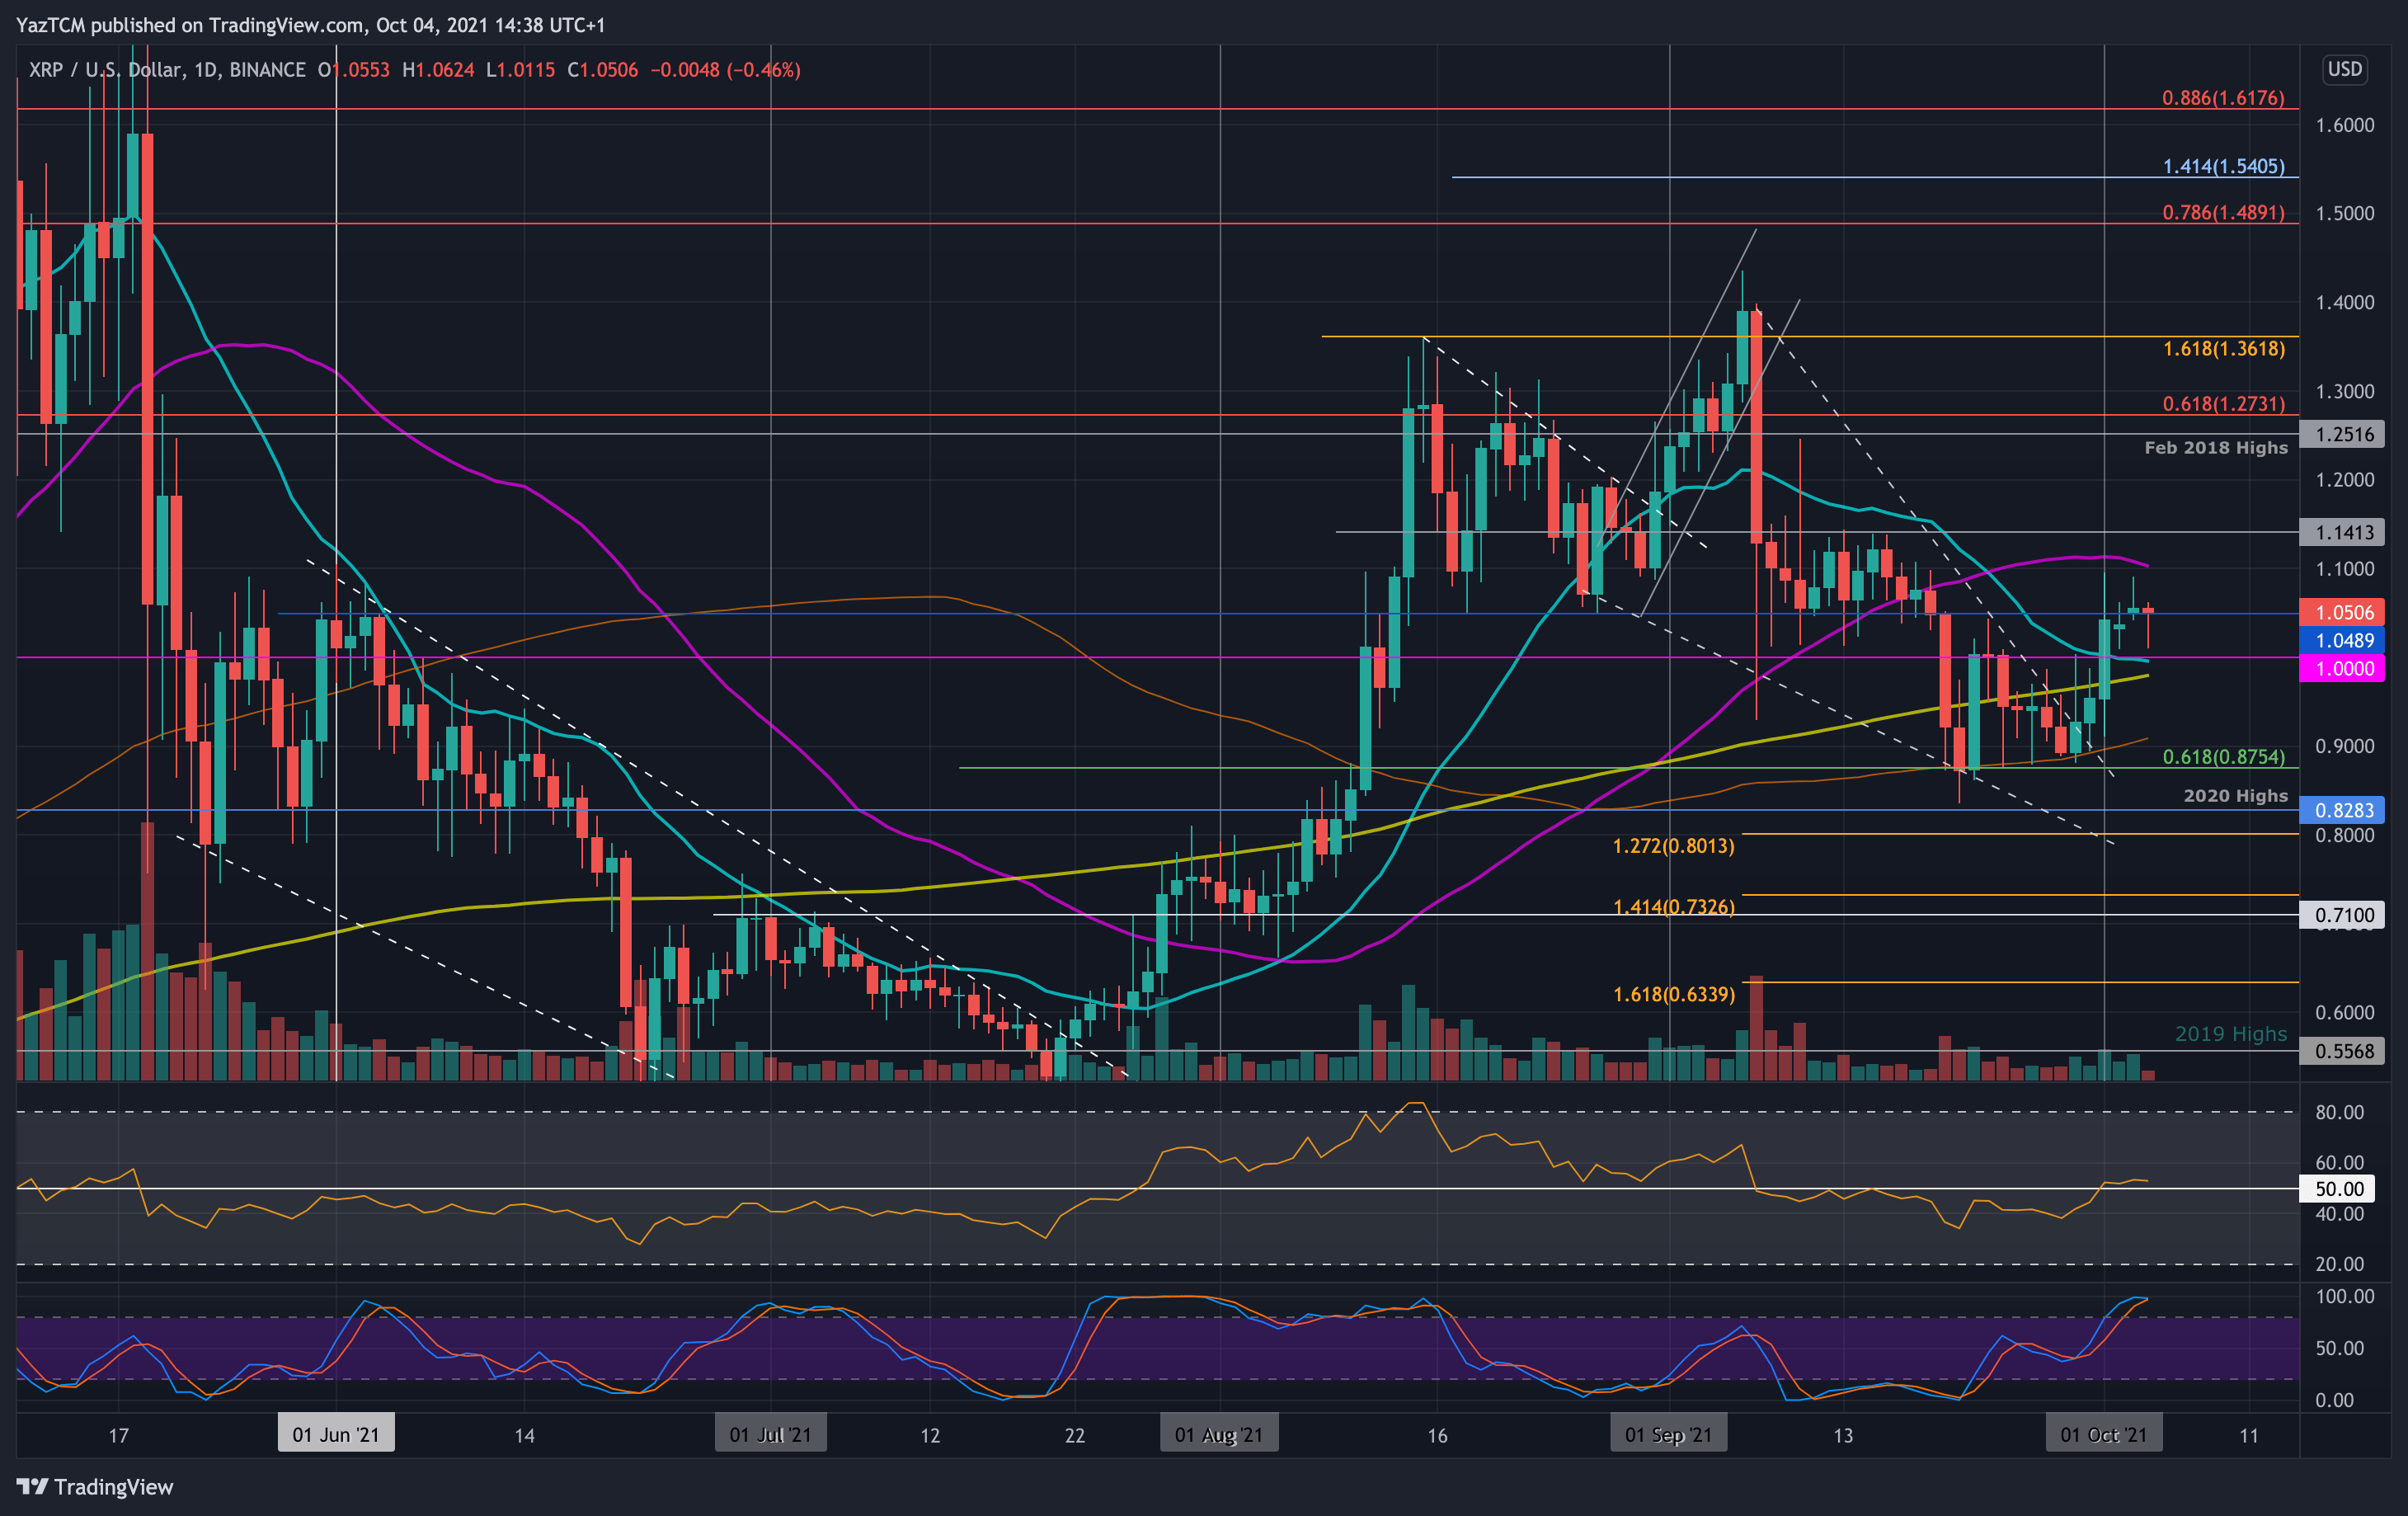
XRP/USD - XRP presses again over $ 1. Important support levels: $ 1.00, $ 0.9, $ 0.875. Last week, XRP was traded in a range between $ 1.00 and the support of $ 0.875 (0.618 FIB). It recovered from the support on Wednesday, making it over 1.00 USD on Friday. Unfortunately, the cryptocurrency at the weekend was unable to overcome the resistance at 1.10 USD (50-day-MA) and has since fallen to USD 1.05, where it is currently being traded. A breakthrough over 1.10 USD (50-day-MA) would certainly return the prerequisites for recovery in ...
XRP breaks through the range of last week and lasts over 1. $
XRP/USD - XRP presses again over $ 1.
Important support levels: $ 1.00, $ 0.875.
Last week XRP was traded in a range of between $ 1.00 and the support of $ 0.875 (0.618 fib). It recovered on Wednesday from the support, making it over 1.00 USD on Friday.
Unfortunately, the cryptocurrency at the weekend was unable to overcome the resistance at 1.10 USD (50-day-MA) and has since fallen to USD 1.05, where it is currently being traded. A breakthrough over 1.10 USD (50-day-MA) would certainly create the prerequisites for recovery back towards the September high of USD 1.40.
XRP-USD short-term price forecast
With a view to the future, the first resistance is 1.10 USD (50-day-MA). This is followed by $ 1.25, $ 1.30, $ 1.40 and $ 1.50 (Bärische 0.786 fib).
On the other hand, the first support is 1.00 USD (20-day-MA). The following follow 0.9 USD (100-day-ma), 0.875 USD (0.618 fib) and 0.8282 USD (Hochs of 2020).
The RSI is just above the center line, which indicates that buyers are fighting to control the market dynamics.
XRP/BTC-Bulls holds 200-day-MA support.
Important support levels: 2100 Sa, 2075 Sa, 2000 Sa.
Important resistance levels: 2225 Sa, 2300 Sa.
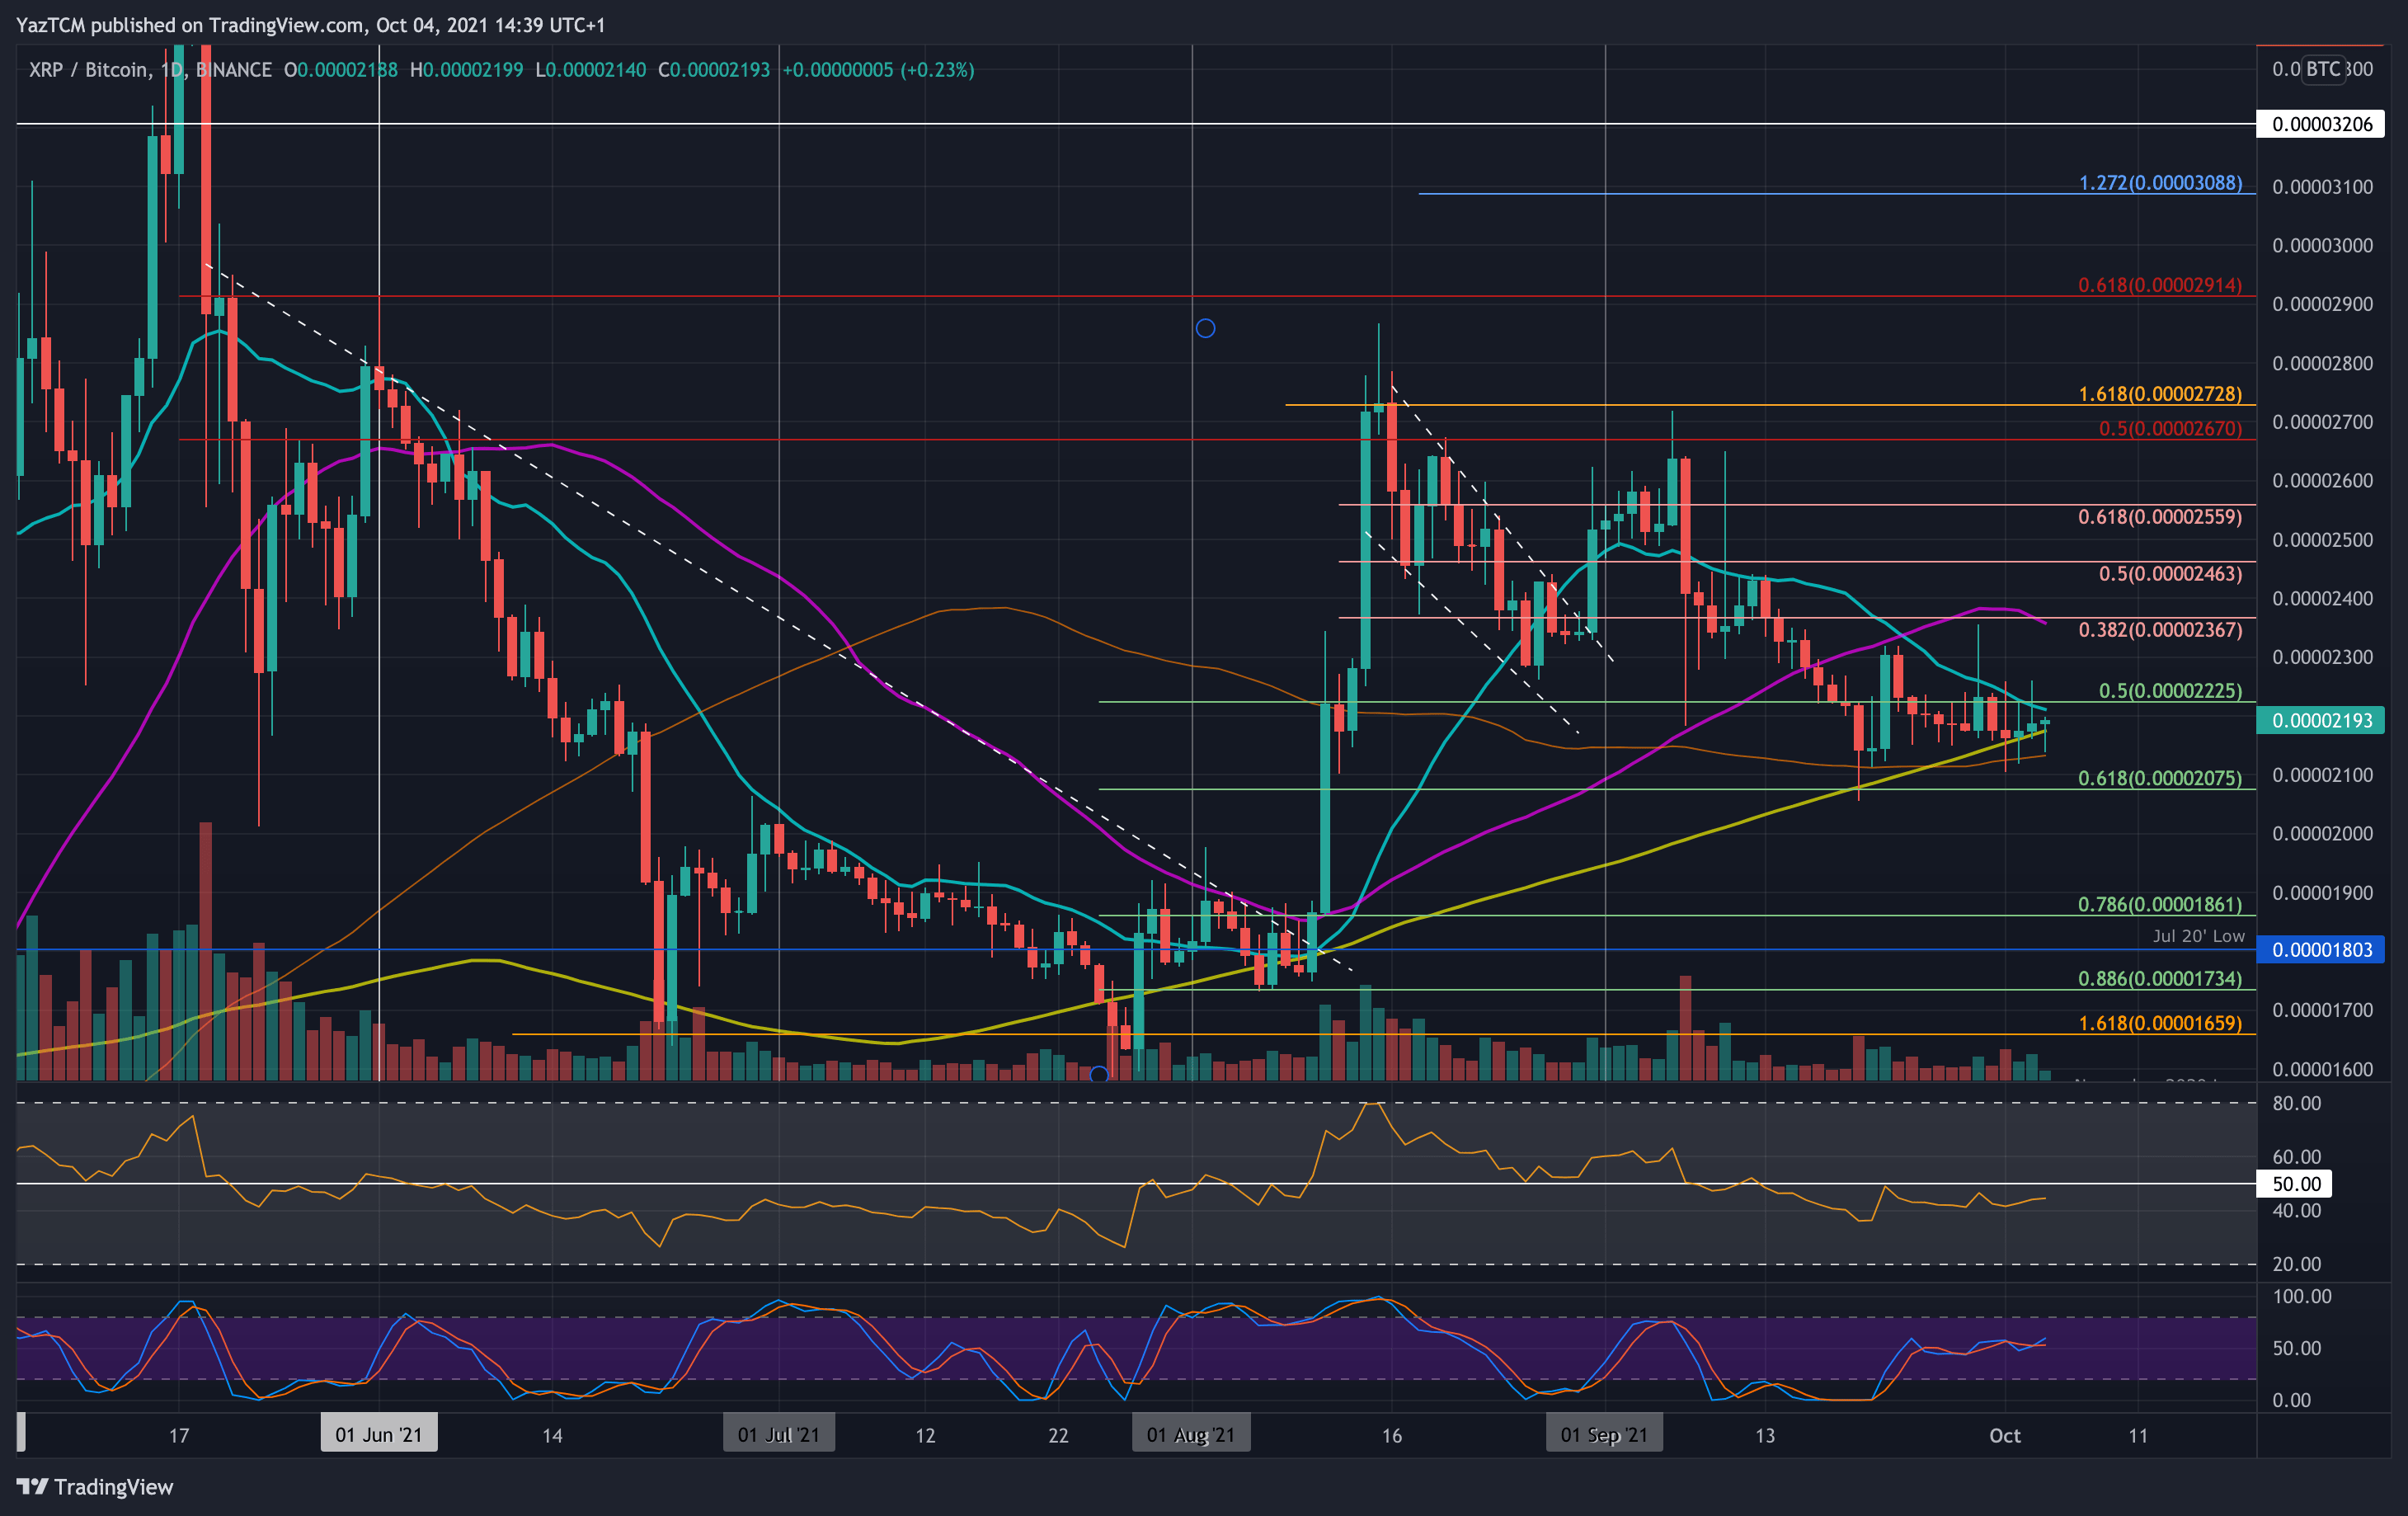
against BTC, XRP is fighting to keep the 200-day-MA support at around 2150 SAT. The cryptocurrency fell to 2100 SAT last week, but the 100-day-MA there prevents it from slipping down.
The coin is beaten between 2100 satellite and 2300 SAT and has to break through this range to set the next direction to the market.
XRP-BTC short-term price forecast
With a view to the future, the first resistance is 2225 SAT (20-day-MA). This is followed by 2300 SAT, 2367 SAT (50-day MA & Bearish .382 FIB), 2460 SAT (Bearish .5 FIB) and 2560 SAT (Bearish .618 fib).
On the other hand, the first support is 2100 SAT (100-day-MA). This is followed by 2075 SAT (.618 fib), 2000 SAT and 1860 SAT (.786 fib).
The RSI remains under this center line because the bears control market dynamics.
.