XRP breaks even even deeper, since $ 0.30 are in the game (Ripple price analysis)
XRP breaks even even deeper, since $ 0.30 are in the game (Ripple price analysis)
rippleder price has dropped in the past few weeks, with two significant sliding average lines being broken down. The price could fall deeper in the coming days because it does not look good from the point of view of the technical analysis.
technical analysis
from: Edris
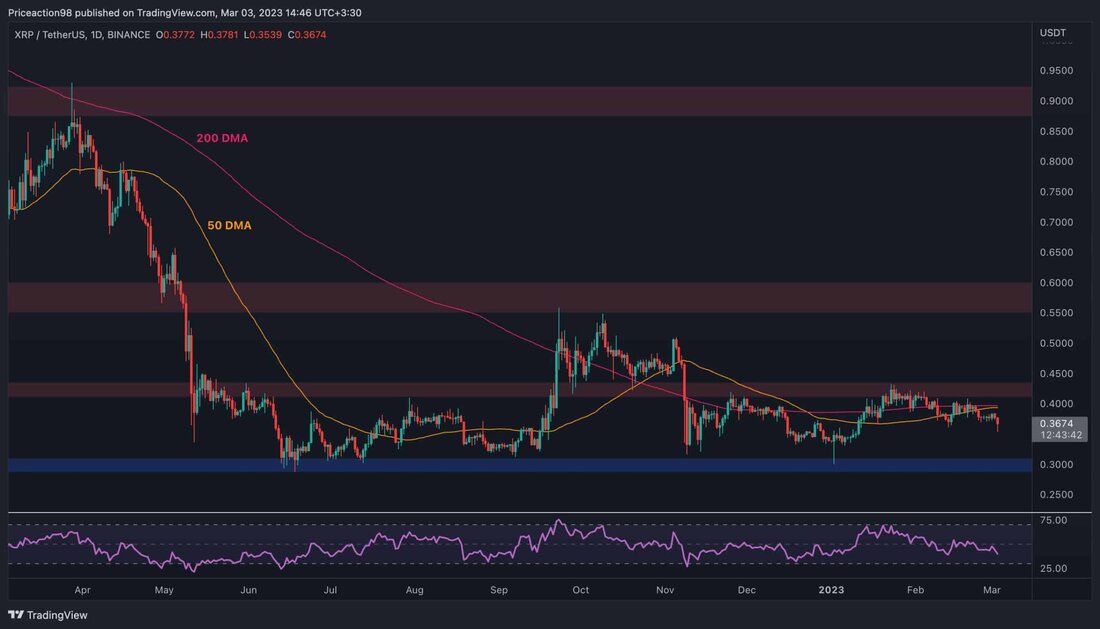
XRP/USDT daily diagram
If you look at the USDT diagram, the price from the significant range of $ 0.43 was rejected and has broken both the sliding 50-day and 200-day line of the sliding average, both of which are around 0.4 $ brand.
At the moment, the market shows a high willingness to fall towards the key brand of $ 0.3, where the lowest low of the current bear market is located. Therefore, a collapse of this area would be catastrophic for buyers, as this would further extend the bear market.
The RSI indicator has also fallen below the 50 %threshold, which demonstrates the current declining dynamics and increases the probability of a deeper short-term decline.
Tradingview
XRP/BTC-Ta-type
It does not look too optimistic about BTC either, since the market structure is clearly declining in the day of the day. Nevertheless, the price is currently above the level of 0.000015, and the sliding 50-day average, which is around the level of 0.000017, could be tested in the next few days if there is a recovery.
It is still expected that the declining price movement continues until the level of resistance of 0.000018 is intact. In addition, the RSI indicator increases after leaving the oversized zone and approaches the level of equilibrium of 50 %.
Since the indicator is still below the threshold, the bears still have control, and a decline in the direction of the 0.000015 mark is still very likely.
Tradingview
.


Kommentare (0)