Will XRP finally explode over $ 0.4? (Ripple price analysis)
Will XRP finally explode over $ 0.4? (Ripple price analysis)
rippleder price of has consolidated in a close range compared to the USD. However, it has to take a significant step compared to BTC.
technical analysis
from: Edris
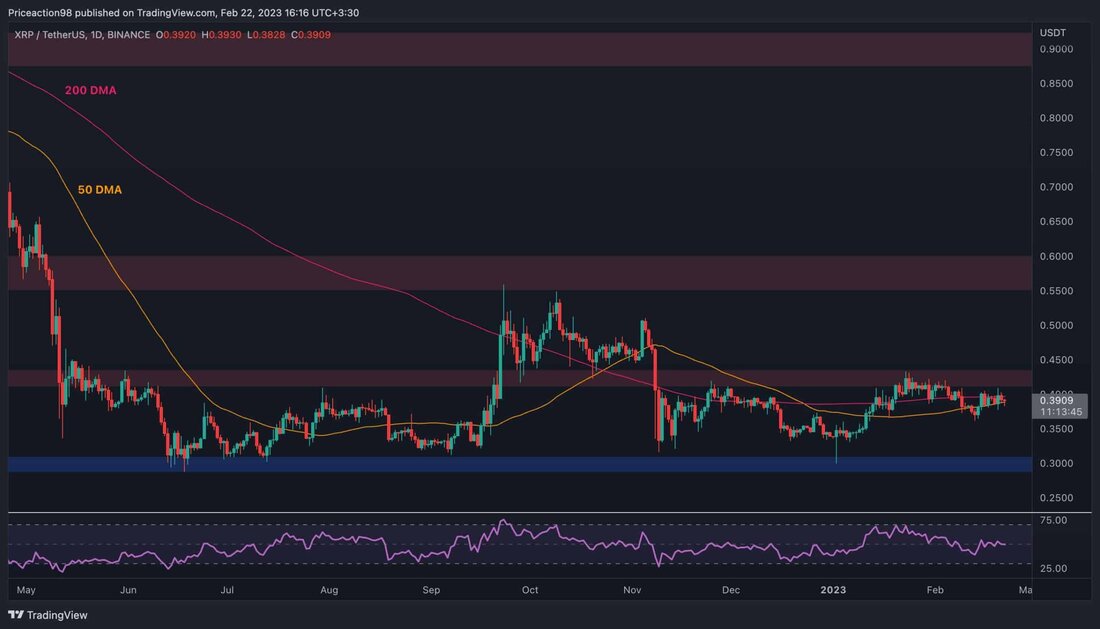
XRP/USDT-TART
The price could not exceed the resistance mark of $ 0.43 and is caught in a tight span between the sliding 50-day and 200-day average line, which is around $ 0.38 or $ 0.4.
A breakout would probably lead to another test of the level of $ 0.43, whereby the probability for an interest bully outbreak is apparently higher this time, since the level should be weakened by so many renewed tests in the past few months.
In this case, a recovery in the direction of the $ 0.6 area would be likely. On the other hand, a collapse of the sliding 50-day average in the coming weeks would lead to a potential decline in the direction of the important level of support of $ 0.3
Tradingview
XRP/BTC-Tageniagramm
If you look at the Bitcoin diagram, the market structure is clearly declining during the day, whereby the significant level of 0.000018 was broken down a few weeks ago.
Since then the price has tended down, but the RSI indicator points to a possible bullish sweater at short notice, with the indicator falling under the oversold zone and recovering over it.
In the case of an interest bully movement, the open level of 0.000018 and the sliding 50-day average, which is roughly in the same area, would be the probable goals. Nevertheless, the price could fall even deeper and test the key brand of 0.000015, which would be the last way out of the bulls to prevent another crash down.
Tradingview
.


Kommentare (0)