Will BTC finally break over $ 30,000 after massive volatility? (Bitcoin price analysis)
Will BTC finally break over $ 30,000 after massive volatility? (Bitcoin price analysis)
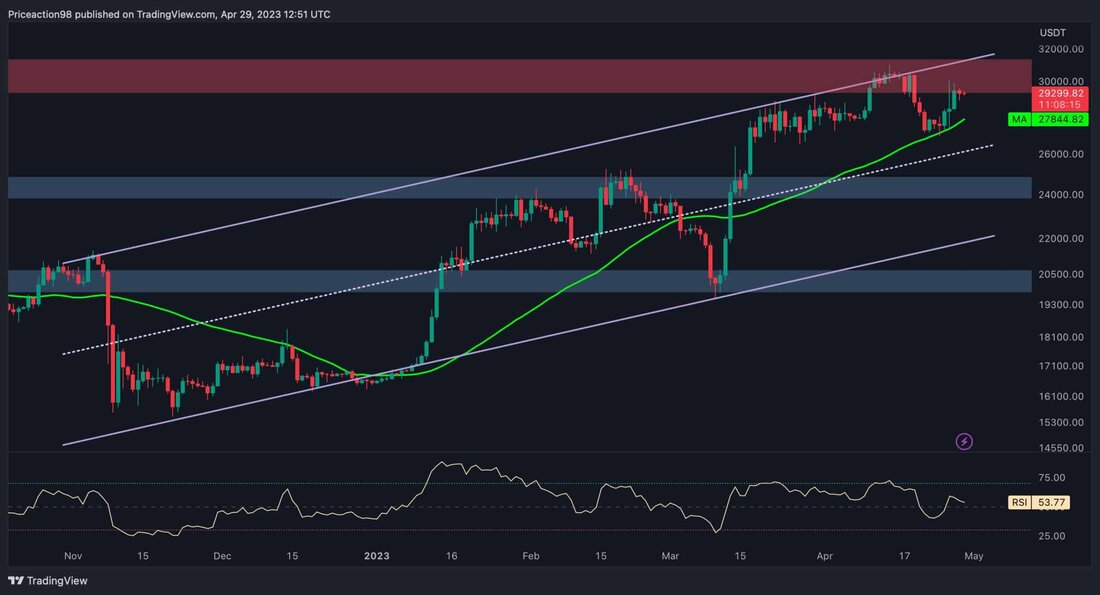
Bitcoin received support in the decisive sliding 50-day average, which is $ 27,000. This has led to a rally that aims to break the significant resistance brand of $ 30,000. Despite the overall interest bully prospects of the cryptocurrency, this price range has potential for rejection.
technical analysis
of Shayan
the daily -type
After a short-term correction, Bitcoin found support with the sliding 50-day average, which is currently $ 27,300, which led to another upward trend. This brought back the bullish mood.
The latest price movement of Bitcoin, however, indicates signs of weakness, since the positive mood is not sufficient to break through the next important resistance region. If BTC succeeds in achieving this decisive price level, an extensive Household rally can probably be expected.
Tradingview
The 4-hour diagram
The price of Bitcoin has entered a critical range between the strong level of support of $ 25,000 and the significant resistance range of $ 30,000. Lately, the price within this range has experienced considerable volatility, which led to massive red and green candles.
Nevertheless, price consolidation in this decisive area is expected at short notice. An outbreak could possibly display the direction of the upcoming trend of Bitcoin.
Tradingview
on-chain analysis
The following diagram offers an excellent overview of Bitcoin's price cycles in addition to the MVRV metric, which is the ratio of Coin’s market capitalization to its realized upper limit. This metric is used to determine whether the price is overvalued.
Historically speaking, MVRV metric falls into the green area during declining market phases, which indicates that Bitcoin acts in the undervalued area and the low point of the cycle forms. However, as the diagram clearly shows, Bitcoin has experienced an increase every time the MVRV metric has risen over 1.The youngest impulsive rally from Bitcoin has led to a strong increase in MVRV metric. Therefore, the market may have entered a medium -term upward phase, which could follow unexpected movements and high volatility.
Cryptoquant
.


Kommentare (0)