Ripple Explodes 11% Weekly, But Bulls Need to Focus on This Resistance Now (XRP Price Analysis)
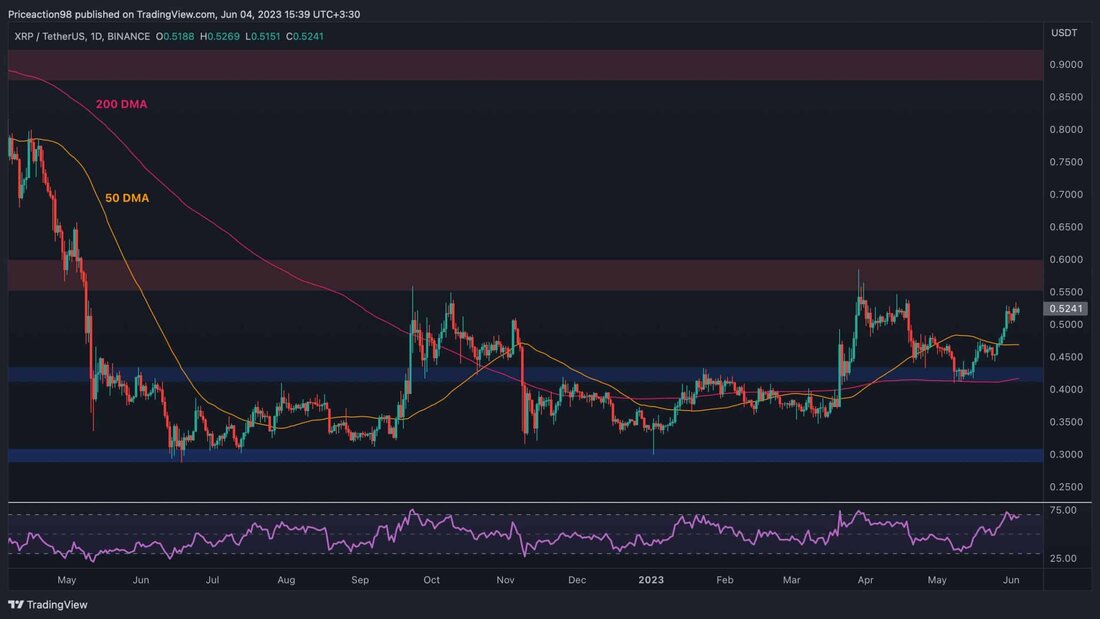
In the last few weeks, Ripple price showed an uptrend and rebounded from a notable support level. However, there is still a key resistance level that must fall for the market to enter an upward phase in the coming months. Technical Analysis By: Edris XRP/USDT Daily Chart: XRP price has continued to rise after recovering from the $0.43 support. This level was also strengthened by the 200-day moving average, while the price crossed the 50-day moving average at around $0.47. Ripple is currently approaching the resistance level of $0.6 and a successful breakout could trigger a potential rally in the coming months...

Ripple Explodes 11% Weekly, But Bulls Need to Focus on This Resistance Now (XRP Price Analysis)
In the last few weeks, Ripple price showed an uptrend and rebounded from a notable support level. However, there is still a key resistance level that must fall for the market to enter an upward phase in the coming months.
Technical analysis
From: Edris
XRP/USDT daily chart:
XRP price has been steadily rising after recovering from the $0.43 support. This level was also strengthened by the 200-day moving average, while the price crossed the 50-day moving average at around $0.47.
Ripple is currently approaching the resistance level of $0.6 and a successful break could trigger a potential rally towards $0.9 in the coming months. However, it is worth noting that the RSI has entered the overbought region, indicating a possible correction in the near future.
TradingView
XRP/BTC daily chart
Looking at the BTC pair chart, a clear uptrend can be seen after the price successfully broke out of the significant descending channel. The 0.000017 SAT and 0.000019 SAT levels, which represent the 50-day and 200-day moving averages respectively, were both exceeded, indicating positive momentum.
Currently, the Ripple price is approaching the psychological resistance level at 0.00002 SAT. However, it is important to note that the RSI indicator signals overbought conditions, suggesting a possible short-term correction before further upside.
TradingView
.

 Suche
Suche
 Mein Konto
