Pepe crashes by 15 % in 7 days, but is there a big step before? (Pepe Coin price analysis)
Pepe crashes by 15 % in 7 days, but is there a big step before? (Pepe Coin price analysis)
The volatility of Pepe has exploded in the past few days, with the price fluctuating over 30 % in one day.
Important support levels: 0.0000013 $
Important resistance level: 0.0000010 $
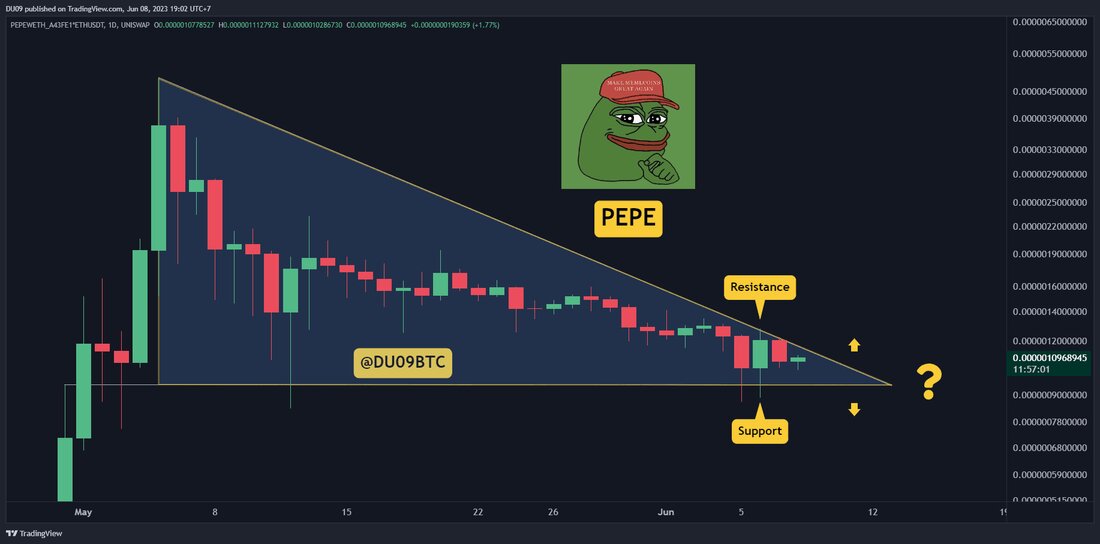
After a long phase of low volatility, Pepe's price development changed on Monday when the Sec Binance sued. The price fluctuated quickly by over 30 % and reached a new low. This creates a large descending triangle that could be interpreted as bear.
The current support is $ 0.0000010 and the resistance is $ 0.0000013. Since the price quickly approaches the peak of this formation, Pepe could take a big step in the next few days.
Diagram of Tradingview
trade volume: The volume increased on Monday, whereby Bären dominated the chart.
rsi : The daily RSI is less than 50 points and, due to the lower maximum, still has a decline in trend.
macd : The daily MacD is negative. However, the histogram has higher deep stalls, which could indicate that this downward trend could reach a low in the near future.
Diagram of tradingview
bias
The tendency for Pepe is bearish.
Short-term forecast for the PEPE Prize
It is likely that the volatility will be high in the next few days and that an outbreak from this triangle will be imminent. Buyers have to do everything to defend the important support at $ 0.0000010. Should there be a failure there, Pepe would clear the way, much deeper and in the direction of $ 0.000005.
.


Kommentare (0)