Possible short -term correction for ETH after testing of $ 2.1,000? (Ethereum price analysis)
Possible short -term correction for ETH after testing of $ 2.1,000? (Ethereum price analysis)
The price of Ethereum has been extremely interest bully in the past few weeks and rose higher every week. While there are numerous signs that the bear market is over, there are some worrying signs at short notice.
technical analysis
from: Edris
the daily -type
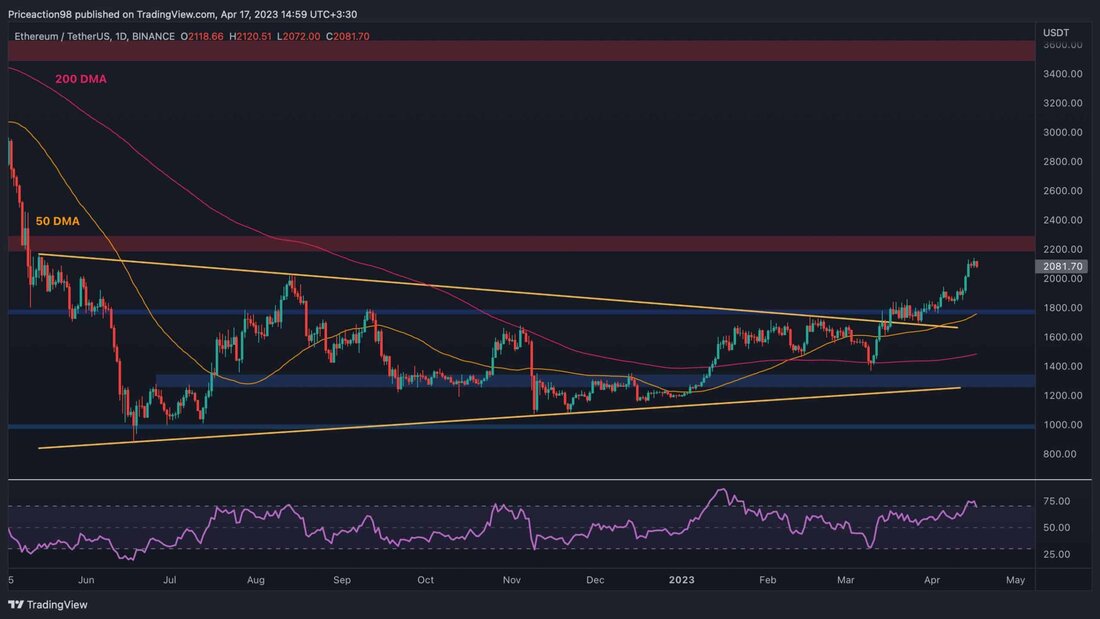
With a view of the daily time frame, the price has recovered aggressively after broken up the large symmetrical triangle. ETH is currently striving for the resistance level of $ 2200 and approaches it quickly. Nevertheless, the RSI indicator shows a clear overbought signal and rises over the 70%mark.
This signal could lead to a decline or consolidation at short notice, either before testing the $ 2,000 mark or afterwards. In this case, $ 1,800 and the sliding 50-day average, which tend to be nearby, could be regarded as support levels to keep the market.
Tradingview
The 4-hour diagram
The upward trend becomes clear on the 4-hour chart, since higher highs and lows and an increasing trend line are classic positive signatures. Nevertheless, the market has had trouble lately, since the RSI also showed an overbought signal in this time frame and fell under the area, which indicates that the dynamics are subsided and a potential pullback can be expected.
Therefore, the level of support of $ 1950 and the bullish trend line should be observed as possible support areas. However, the market could continue to rise before corrected and finally reached the resistance area of $ 2200. Although the pattern of the RSI is worrying, the market is still in an upward trend in this time frame from a classic price action.
Tradingview
mood analysis
from: edris
Ethereum-Open-Interest
In the past few months, Ethereum's price has increased and has attracted investors and speculators. While this is usually interpreted as a positive sign, too much speculation can be problematic, as was the case in the past.
The following graphic shows the Open Interest from Ethereum, which measures the number of open perpetual futures contracts. Higher values are usually associated with the upward mood, while lower values indicate that fear dominates the market.
After the latest ETH price rally, the open interest has increased massively, which indicates a significant increase in speculation.
These point usually follow considerable volatility and sudden price corrections. Therefore, investors should be careful because due to a possible long liquidation cascade, a sweater or even a declining trend reversal could be expected at short notice.
Cryptoquant
.


Kommentare (0)