Do $ 30,000 or a correction come after the outbreak of Bitcoin? (BTC price analysis)
Do $ 30,000 or a correction come after the outbreak of Bitcoin? (BTC price analysis)
The price of Bitcoin recovers after he has exceeded a significant level of resistance. However, the 2022 bear market is not over until another critical level is broken up.
technical analysis
from: Edris
the daily -type
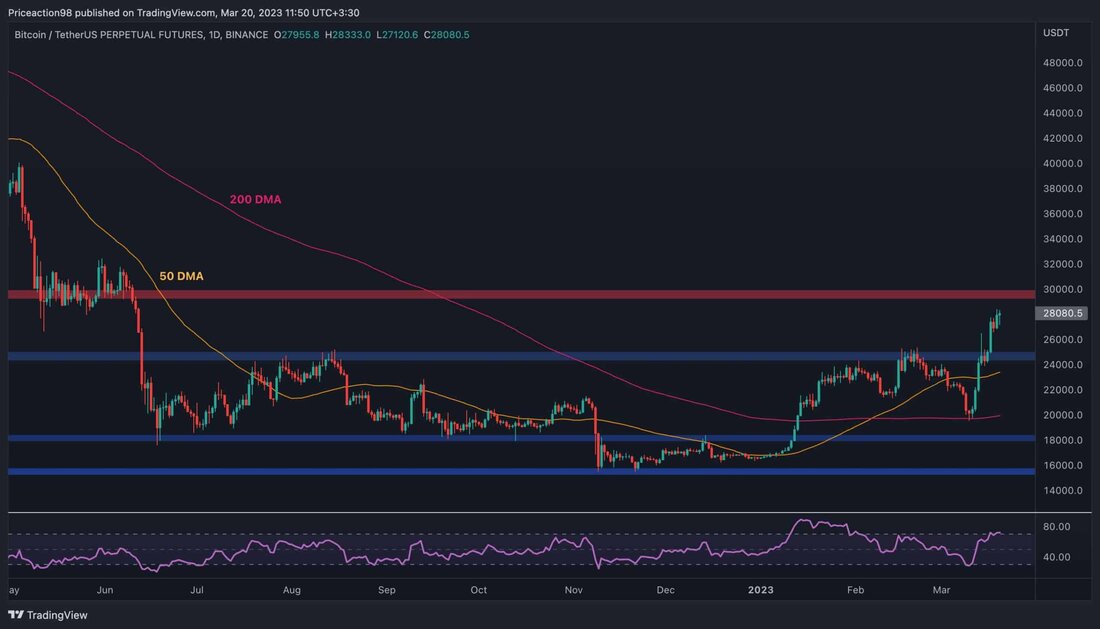
on the daily chart, Bitcoin's price had experienced a massive upward trend last week, after a V-shaped recovery from the sliding 200-day average, which was in the middle of the $ 20,000 mark, followed by a decent outbreak over the $ 25,000 resistance brand.
The price currently moves towards the key area of $ 30,000, a medium -term resistance in which an outbreak would probably lead to an upward phase in the coming months.
The RSI indicator has entered the overbought area and signals a possible withdrawal or consolidation at short notice. In this case, the $ 25,000 range could be tested again, since it now acts as a level of support.
The 4-hour diagram
In the 4-hour period, the price of Bitcoin has increased almost vertically. It recently broke the $ 25,000 mark and tested it again before it increased.
While the market structure is bullish in this time frame, consolidation or a sweater is still possible, since the 4-hour RSI indicator shows a clear declining divergence between the latest spa highs. Although the level of $ 25,000 should offer support, a deeper pullback could lead to a renewed test of the level of $ 23,000.
Despite the above, if the price movements are taken into account both on the daily and on the 4-hour chart, it may only be a matter of time before Bitcoin reaches the $ 30,000 mark for the first time in almost a year. The pullback could be delayed until the level of $ 30,000 is reached.
on-chain analysis
of Shayan
The price of Bitcoin has initiated a strong upward trend in the past few weeks and triggered a sudden increase. The market participants, in particular the small investors, could see the recent price increase as an opportunity to realize some profits and to control their risk.
As the following graphic shows, the key figure of the stock market reserves had dropped until the price suddenly increased and the decisive mark of $ 25,000 exceeded. Since then, the metric has risen slightly and has started an upward trend, which means that the inflows to the stock exchanges exceed the drains and the participants send Bitcoin to the exchanges for the purpose of selling. The behavior of this metric should be tracked in the coming days.
.


Kommentare (0)