Here is the critical level of support when BTC falls below $ 27,000 (Bitcoin price analysis)
Here is the critical level of support when BTC falls below $ 27,000 (Bitcoin price analysis)
After a decisive rejection of the resistance level of $ 30,000,Bitcoin showed a relatively declining price movement, but recently lost important support. Nevertheless, there are still several crucial zones that the price can rely on.
technical analysis
from: Edris
The daily chart
After a failed outbreak in early April, the price consolidated under the resistance brand of $ 30,000. Due to the downward pressure in the last few days, the sliding 50-day average was broken down around the $ 28,000 mark.
The support range of $ 25,000 could be the next goal, followed by the critical sliding 200-day average, which is around $ 22,000. Both are of great importance, and a falling below these values would be catastrophic for buyers who strive for upward trend.
On the other hand, another breakthrough over the sliding 50-day average would probably sabotage the downward scenario, and the price would probably exceed the $ 30,000 mark this time. Tradingview
The 4-hour diagram
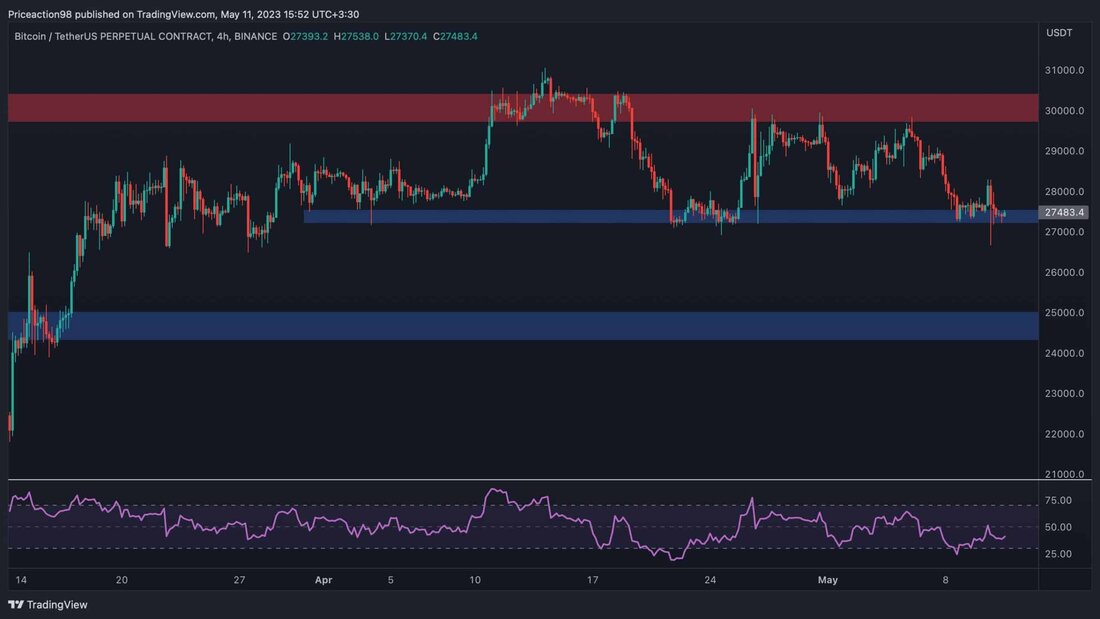
If you look at the 4-hour time frame, the latest consolidation becomes clearer, since the price has apparently fluctuated between the levels of $ 30,000 and $ 27,500 in the past few weeks.
The $ 27,500 mark, an important support zone that has already kept the market in suspense several times, is currently under fire, and a breakthrough would lead to a lower decline in the direction of the $ 25,000 area.
The RSI also shows values below 50 %, which indicates the declining dynamics in this time frame. This increases the likelihood of continuation of the downward trend in the coming weeks.
Tradingview
on-chain analysis
Bitcoin Taker purchase/sales ratio
The Bitcoin price has consolidated the important resistance brand of $ 30,000 after a rally since the beginning of 2023. The most recent indecisiveness of the price has caused many investors to ask themselves whether the bear market is really over or whether the price will be able to cross the $ 30,000 mark. Therefore, the analysis of the mood at the appointment market could provide helpful knowledge.
This diagram shows the taker-Buy-Sell ratio metric, which determines whether the bulls or the bears dominate. Values over 1 indicate that long retailers act more aggressive, and vice versa values under 1 point to the dominance of the bear.
A look at the graphic clearly shows that this indicator has had a trend of below 1 in the past few months, and this could be one of the main reasons why BTC could not break the $ 30,000 mark. This aggressive sales pressure could reverse the trend and push the price down if things stay the same.
Although BTC has recovered significantly since the beginning of the year, the bear market may not be over yet.
Cryptoquant
.


Kommentare (0)