Ethereum price analysis: ETH fights for $ 3500, while Bitcoin continues to dominate
Ethereum price analysis: ETH fights for $ 3500, while Bitcoin continues to dominate
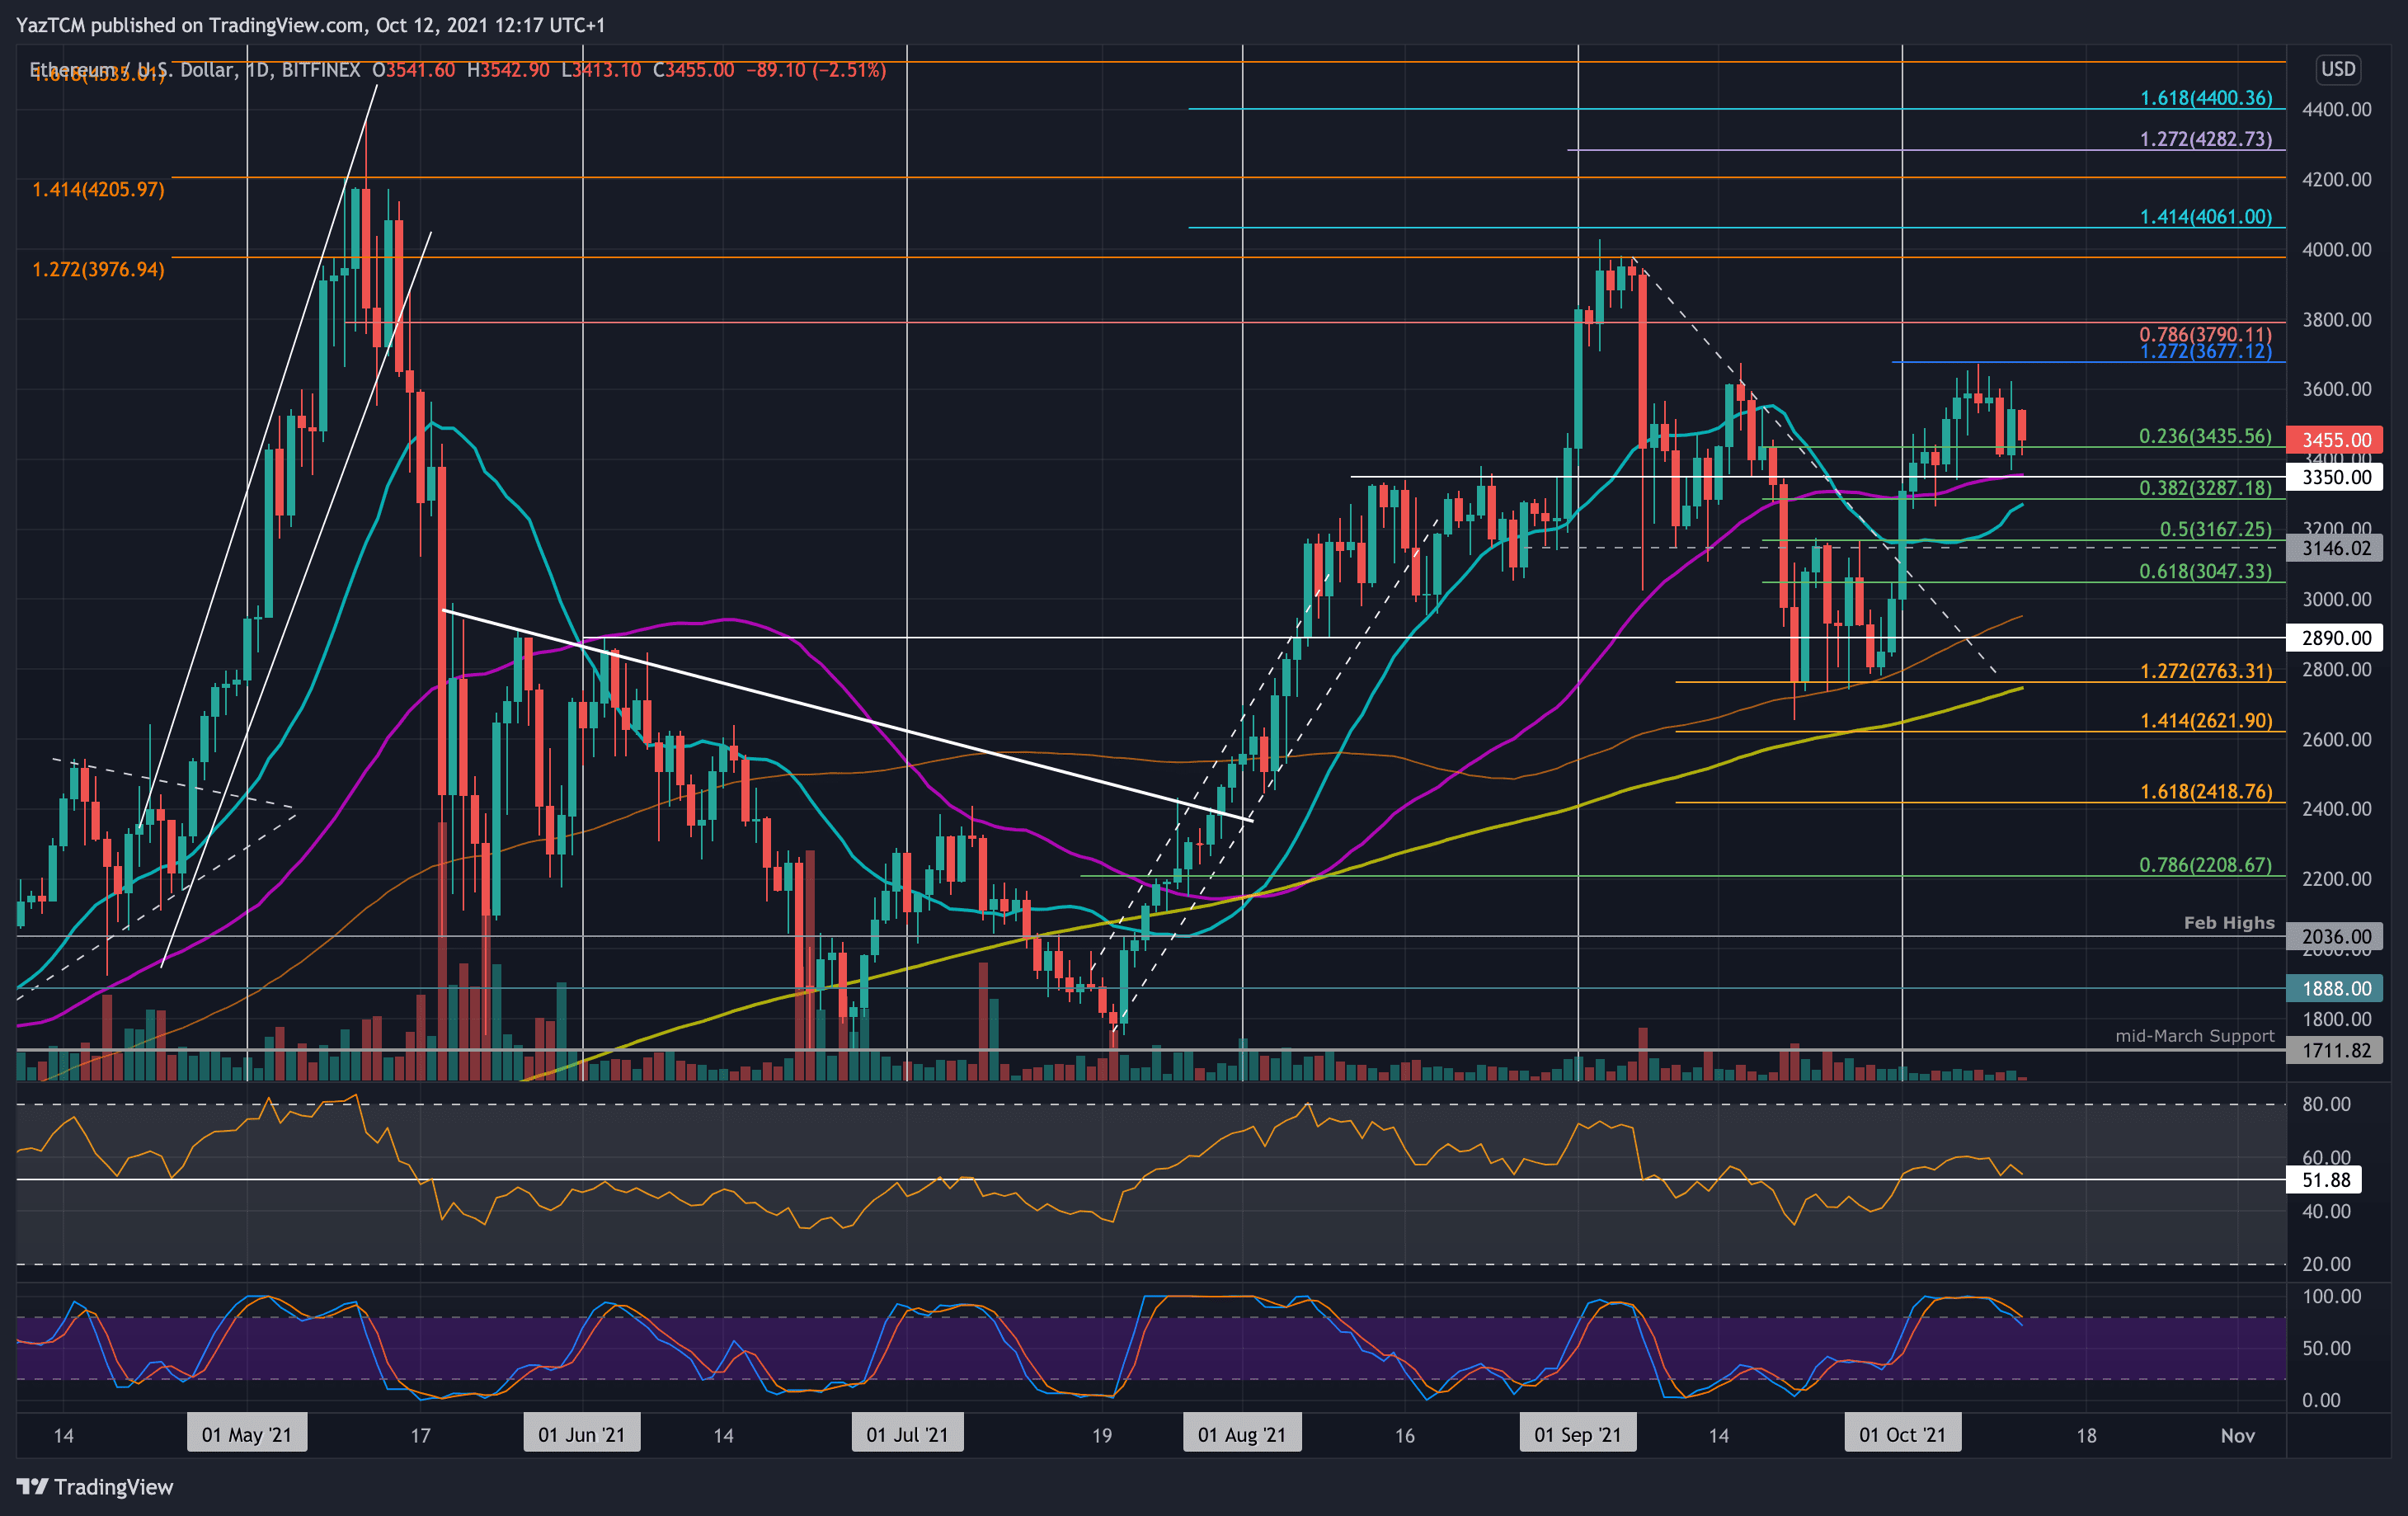
ETH/USD - Ether still has to be over $ 3600. Close
Important support level: $ 3400, $ 3350, $ 3287. important resistance levels: $ 3600, $ 3677, $ 3790
Etheruem today fell slightly by 2.5% in the direction of the support of USD 3400. Ethereum recovered from $ 2800 at the end of September and began to rise higher. By the end of last week ETH had managed to reach $ 3677.
In more detail, ETH was unable to close a day candle over the resistance at $ 3600 and rolled out of there to find support at 3400 USD on Sunday. He has now set a short-term range between $ 3,600 and $ 3,400 and has to break out to determine the next direction.ETH-USD short-term price forecast
With a view to the future, the first resistance is $ 3600. This is followed by $ 3677 (October high), $ 3790 (Bärische 0.786 FIB) and $ 4,000.
On the other hand, the first support is $ 3,400. This is followed by $ 3350 (50-day-MA), $ 3287 (0.382 FIB & 20-day-MA), $ 3167 (0.5 fib) and $ 3,000
The daily RSI stays above the center line, but struggles to continue to win over the ground. This indicates indecisiveness within the market, since it deals within the specified range.
ETH/BTC-bears under 200-day-ma.
Important support level: 0.06 BTC, 0.0582 BTC, 0.057 Btc.
Important resistance levels: 0.062 BTC, 0.0632 BTC, 0.0643 Btc.
Ethereum has been struggling enormously since the beginning of September when it was overwhelmed by resistance at 0.0787 BTC. Since then, ETH has fallen by almost 24% to reach the 0.06 BTC level today.
Ethereum started October with a decline of 0.072 BTC to find support at 0.0643 BTC (0.618 FIB). The support at 0.0643 BTC was broken on Sunday, and ETH continued yesterday under the 200-day MA and today reached 0.06 Btc.
 ETH/BTC-TAGEDIAGRAM. TradingView.
ETH-BTC short-term price forecast
In the future, the first support is 0.06 BTC. This is followed by 0.0582 BTC, 0.057 BTC, 50.056 BTC and 0.0551 BTC (April 2018 deep stalls).
On the other hand, the first resistance is 0.062 BTC (200-day-MA). This is followed by 0.0632 BTC, 0.0643 BTC, 0.066 BTC and 0.067 BTC (100-day-ma).
The daily RSI is clearly below the center line, which indicates that the bears have the market dynamics completely under control.
.


Kommentare (0)