ETH crashes by 5 % a day, will hold $ 1.8,000 or is there a deeper correction? (Ethereum price analysis)

ETH crashes by 5 % a day, will hold $ 1.8,000 or is there a deeper correction? (Ethereum price analysis)
After a phase of consolidation and correction, Ethereum's course has recently reached the decisive level of support of the sliding 50-day average. However, it is currently going through a close price range between the 50-day-MA and the significant level of resistance of $ 2,000.
technical analysis
of Shayan
the daily -type
When analyzing the daily charts, the price previously formed a higher high pattern before experiencing a significant decline. The sliding 50-day average served as a level of support at $ 1.8,000, which led to considerable volatility in lower periods and a considerable shadow on the daily chart.
If the price succeeds in exceeding the resistance of $ 2,000 and its previous swing at $ 2,100, this could possibly trigger an extensive rally. However, if it falls below the 50-day MA, the sliding 100-day average becomes $ 1.7,000 at the primary level of support.
Tradingview
The 4-hour diagram
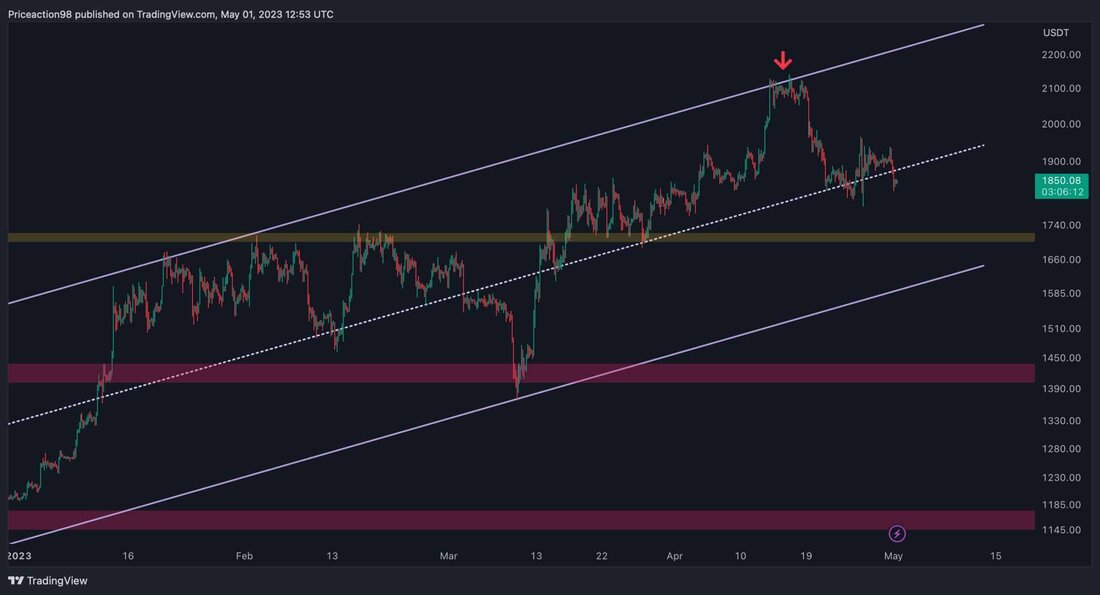
When analyzing the 4-hour charts, the price was rejected by the upper threshold of the rising channel, which led to a downward trend towards the average trend line of the canal. Despite enormous volatility after reaching the trend line, the purchase pressure in this critical region remains obvious.
If the price falls below this essential level, the next stop for Ethereum would be $ 1.7,000. However, if the ETH finds support in this region, the bulls could possibly try another run in the direction of the $ 2.1,000 mark.
Tradingview
on-chain analysis
from: Edris
The price of ETH has recently fallen after it has followed the upward trend of the past few months. If you look at the metrics of the mood on the futures markets, it seems that the long liquidation cascade is the culprit.
This diagram shows the open interest of Ethereum, which measures the number of open futures contracts. The open interest usually increases when the market mood is bullish and higher values lead to more volatility at short notice.
If you look at the latest price movement and the open interest diagram, it is obvious that this key figure has increased towards the end of the latest rally, but has also fallen significantly than the price has fallen. This sudden drop in price is probably due to the fact that the long positions are liquidated and increase sales pressure, which further worsens the decline.
This event is referred to as liquidation cascade and usually occurs when the open interest rises quickly. Due to the massive liquidations, however, this key figure now has lower values, and at short notice, a lower volatility can be expected.
Source_Cryptoquant
.
