ETH rises by 10 %weekly, is $ 2,000 imminent? (Ethereum price analysis)
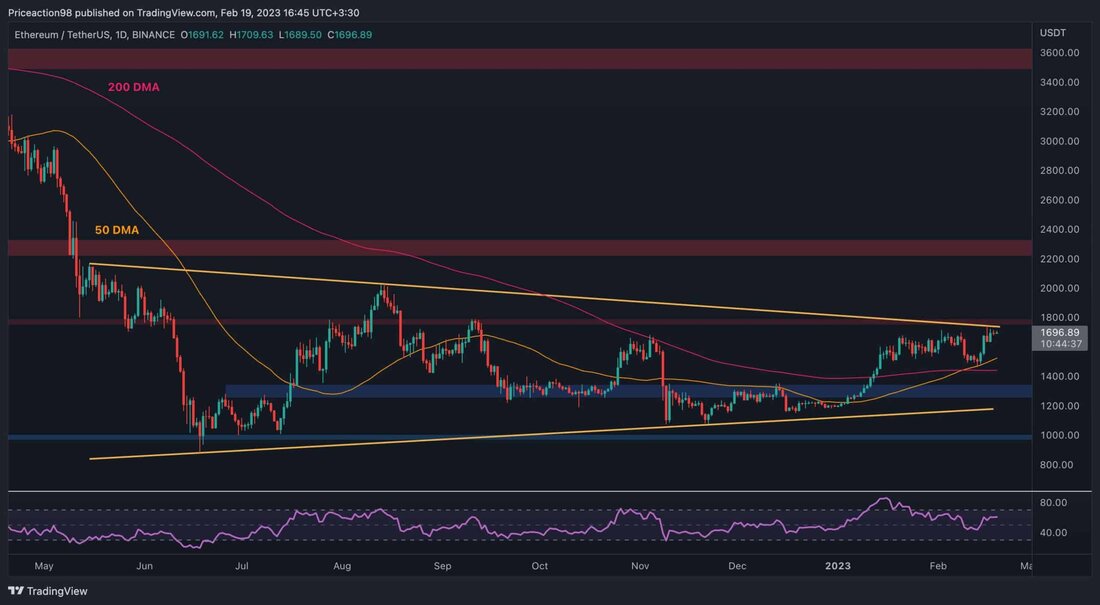
The price of Ethereum has achieved an important level of resistance after the recent relaxation and rally from the $ 1100. The short -term price campaign of the ETH now depends on the reaction to this key level. Technical analysis of: EDRIS DER TAGTART: In the daily time frame, the price after a consolidation of a few weeks has finally reached the upper limit of the large symmetrical triangle. The price tested the level of $ 1800 and the higher trend line of the triangle yesterday, but was rejected. Nevertheless, there is still a significant probability that the course will break through the resistance area mentioned, which could lead to a rally in the direction of the $ 2400 mark. ...

ETH rises by 10 %weekly, is $ 2,000 imminent? (Ethereum price analysis)
The price of Ethereum has achieved an important level of resistance after the recent relaxation and rally from the $ 1100. The short -term price campaign of the ETH now depends on the reaction to this key level.
technical analysis
from: Edris
the daily type:
In the daily time frame, the price finally reached the upper limit of the large symmetrical triangle after a consolidation of a few weeks.
The price tested the level of $ 1800 and the higher trend line of the triangle yesterday, but was rejected. Nevertheless, there is still a significant probability that the course will break through the resistance area mentioned, which could lead to a rally in the direction of the $ 2400 mark.
However, if there is a declining sweater, the sliding 50-day and 200-day average could offer support for the range of $ 1,450 or $ 1,500. Tradingview
The 4-hour diagram:
If you look at the 4-hour chart, the price was rejected by the upper border of the triangle with high precision. The market is currently testing the level of $ 1680, which has turned into support after it has been broken up.
If the level of $ 1680 cannot hold the price, the area of $ 1500 would be the next likely goal for a deeper withdrawal.
The RSI indicator, who has signaled a potential rejection with a clear overbuilt signal, still shows values over 50, which shows that the bulls still have control and a bullish sequel could be the more likely result.
The current structure can change drastically if the RSI falls below 50 and the price breaks down the $ 1500 mark. In this case, a lower decline in the direction of the support level of $ 1350 would be expected.
Tradingview
.

 Suche
Suche
 Mein Konto
