ETH is facing great resistance, are the next $ 1600 or $ 2000? (Ethereum price analysis)
ETH is facing great resistance, are the next $ 1600 or $ 2000? (Ethereum price analysis)
The price of Ethereum has consolidated in the past week because the price is struggling to break an important resistance area. Did ETH mark a local tip?
technical analysis
by: edris
the daily type:
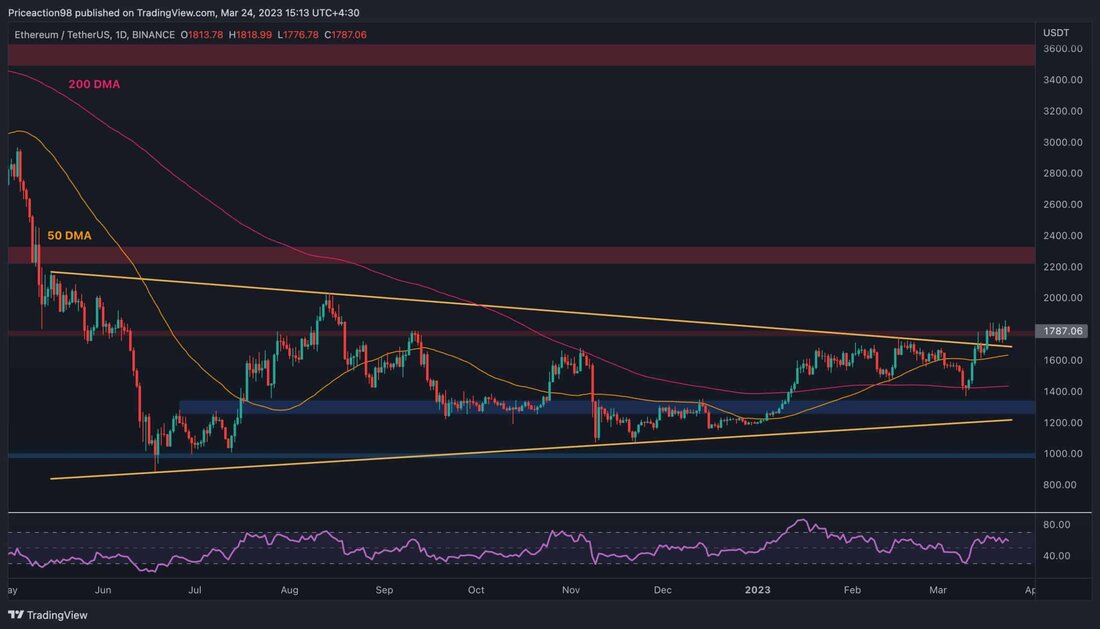
In the daily time frame, the ETH price has recently been broken via the symmetrical triangle pattern and via the gliding 50-day average line (around $ 1600 mark). However, ETH acts within a very narrow span of the broken triangle and still has to break confidently over the $ 1800 mark.
If the market fails, a pullback could be expected towards the 50-day and even the sliding 200-day average, which is around $ 1600 or $ 1400. On the other hand, a valid breakthrough via the $ 1800 mark could lead to another short-term rally-initially with the aim of reaching the $ 2,000 brand for the first time in 2023, and then another destination in the area of the $ 2300 brand.
The 4-hour diagram
On the 4-hour chart, consolidation becomes clearer, since the price of the resistance mark of $ 1800 has recovered. The RSI indicator has been showing a clear declining divergence signal for some time that could indicate a sweater in the coming days.
In this case, the $ 1650 mark could be tested again as support, followed by the $ 1500 mark. However, it is still too early to predict whether the upward trend will continue or reverse, since the market has to decide in view of the resistance of $ 1800.
an-chain analysis
from: Edris
Ethereum-Open-Interest
The price of Ethereum has increased steadily in recent months after moving around the support brand of $ 1,000. However, the appointment market behaves very differently than in previous years when the market experienced short -term rally during the recent Baisse.
The open interest metric (OI) measures the daily number of open futures contracts and is a practical indicator for evaluating the futures market mood. In general, high volatility and declining reversations are followed by increasing open interests. However, the open interest has remained relatively low during the youngest rally.
As a result, the upward trend could still stop, since the likelihood that long liquidation cascades will occur at short notice is lower. Note - the spot market should also be considered for more precise forecasts.
.


Kommentare (0)