ETH sees this level when it crashes below $ 1.6,000 (Ethereum price analysis)

ETH sees this level when it crashes below $ 1.6,000 (Ethereum price analysis)
The price of Ethereum is struggling to break through an important level of resistance after a considerable rally in recent months. However, there are several levels of support that could hold the price in the event of a reversal.
technical analysis
from: Edris
the daily -type
In the daily time frame, the price has not succeeded in breaking the $ 1800 mark and the upper limit of the large symmetrical triangle pattern.
The cryptocurrency currently seems to be faced down with a rejection, with the sliding 50-day and 200-day average lines available as potential support levels around $ 1550 and $ 1400. If the market withdraws even deeper, the support zone of $ 1300 would be a key area that needs to be observed.
Tradingview
The 4-hour diagram
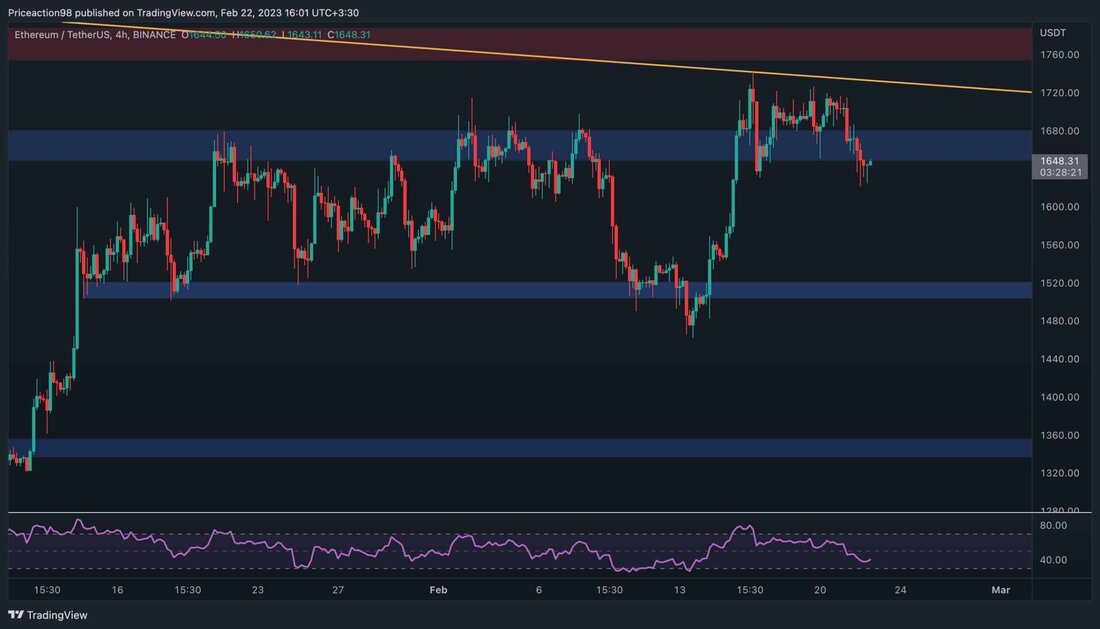
When looking at the 4-hour chart, the latest price movement becomes clearer. ETH currently breaks down below the $ 1650, which could lead to a lower decline in the direction of the $ 1500 mark if there is a valid outbreak.
The RSI indicator has also fallen below the threshold of 50 %, which indicates the dominance and the declining momentum of the current seller. Nevertheless, the price could increase even higher if the level of $ 1650 is kept. This could possibly lead to a breakthrough over the upper limit of the triangle and a renewed test of the resistance area of $ 1800 in the coming days.
Tradingview
mood analysis
of Shayan
Since 2018, the appointment market has had a significant influence on the price of Ethereum. Therefore, an examination of the mood would be helpful to get insights into short -term price movements.
The Taker Buy Sell Ratio metric (added with a 30-day SMA) can be used to define the market perspective. With the help of this function, we can determine whether the purchase or sales pressure is considerable, whereby values are indicated by one in an interest bullish and under 1 in a bearish mood.
At the same time as the latest upward trend from Ethereum, the key figure increased, which indicates an upward mood on the market. However, the price entered into a consolidation phase, which led to a significant decline in metric under one. As a result, he fell to a new multi -month low, which indicates a predominant declining mood.
The youngest rally should be observed in the coming weeks to determine whether this was just another bull trap or the beginning of a new bull market, since the sellers could dominate again.
Cryptoquant
.
