ETH flatlines at $ 1.8,000, what's next? (Ethereum price analysis)
ETH flatlines at $ 1.8,000, what's next? (Ethereum price analysis)
The price of Ethereum has recently been caught in a tight span and hardly showed the intention to move significantly to one side. However, changes can be expected shortly.
technical analysis
from: Edris
The daily chart
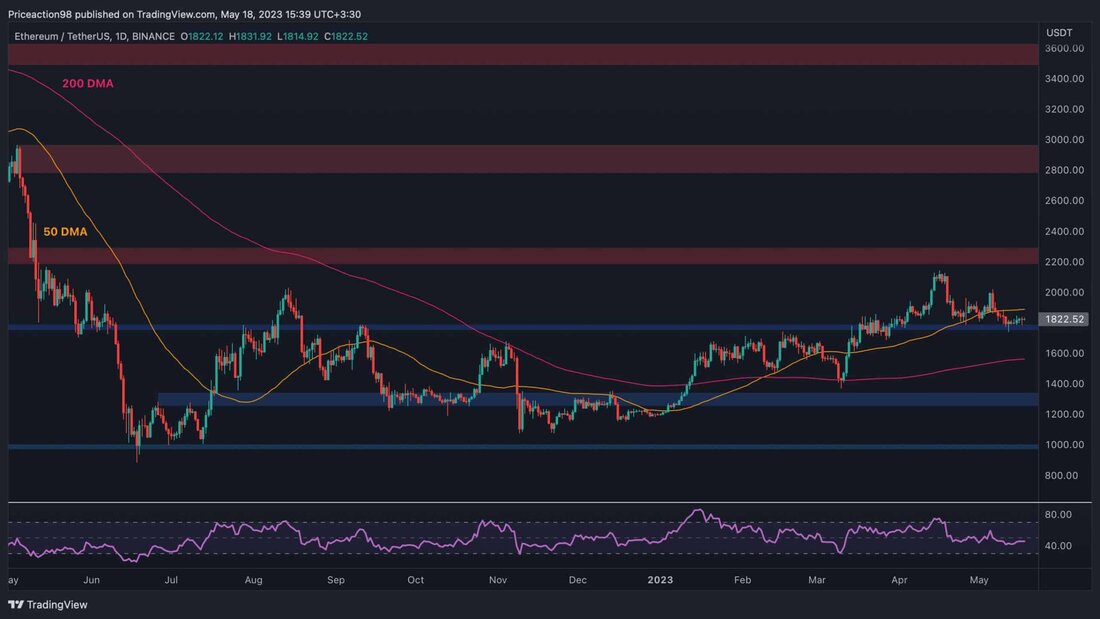
In the daily time frame, the price fluctuated between the sliding 50-day average around the 1900 dollar brand and the static support level of $ 1,800.
From a classic PA perspective, the market will probably reach lower levels, since it has recently reached a lower high and a lower low. In this case, the $ 1,800 mark could be broken, and ETH could test the critical sliding 200-day average, which tends around the $ 1,600 mark.
If ETH, on the other hand, climbs over the sliding 50-day average, it would probably increase higher and finally test the resistance range of $ 2,200 at short notice.
Tradingview
The 4-hour diagram
A look at the 4-hour chart shows that the price below the $ 2,000 mark has formed a large falling wedge pattern. An outbreak of this pattern would be a classic continuation pattern that would probably lead to a rush to the resistance zone of $ 2,200.
Nevertheless, the price still has a long way to reach the upper limit of the pattern, since it is currently testing the support area of $ 1,800. The RSI indicator also only delivers minimal knowledge, since it was relatively flat around the 50 %mark, which indicates a balance of dynamics.
Tradingview
mood analysis
Ethereum financing rates
The price of Ethereum has been pressed under the $ 2,000 mark in the past few weeks and has been consolidated since then. The indecisiveness on the chart can also be seen on the basis of the assessment of the mood on the futures market.
This diagram shows the key figure of the financing rates, which indicates whether the mood on the appointment market is relatively bullish or bear. Positive values are associated with a bullish market mood, while negative values show a bearish mood.
It is clear that this key figure has been consistently positive and negative values after a phase of a constant positive financing rates during the price rally since the beginning of 2023.
One could interpret it in such a way that neither the bulls nor the bears have established their dominance on the appointment market and the price could still move in a certain range until the location of the derivatives changes.
Cryptoquant
.


Kommentare (0)