ETH finds bullish momentum, but will $ 2,000 finally fall? (Ethereum price analysis)
ETH finds bullish momentum, but will $ 2,000 finally fall? (Ethereum price analysis)
The price of Ethereum has made corrections in recent months after the rally. However, there are many levels of support that could keep the price at short notice.
technical analysis
from: Edris
the daily -type
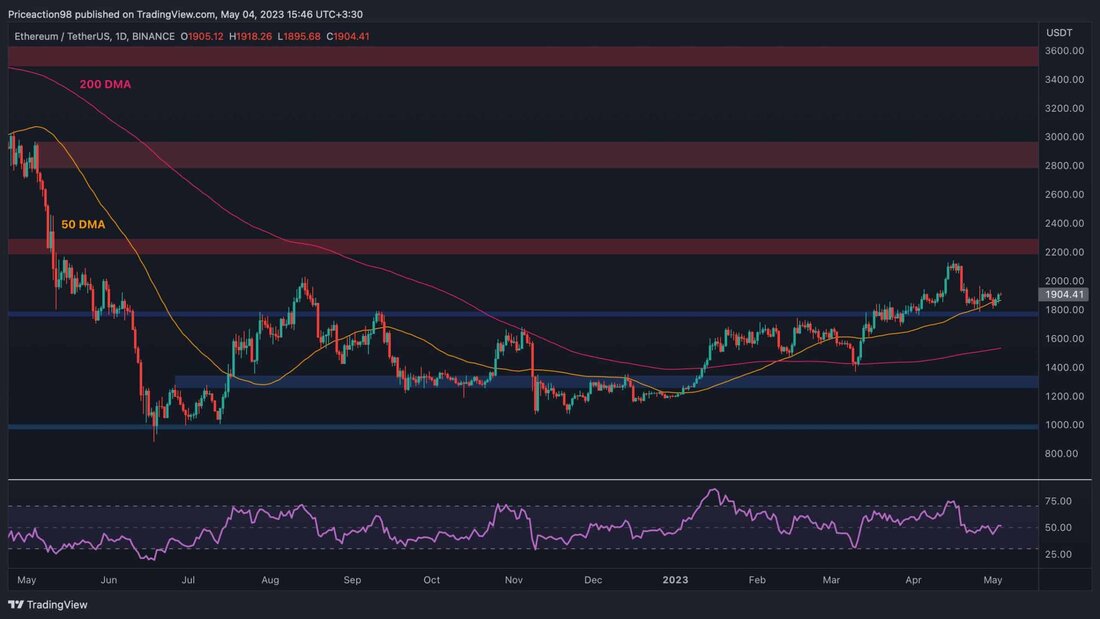
If you look at the daily time frame, the price has dropped over a period of several weeks after not reaching the resistance mark of $ 2200. The sliding 50-day average currently holds the market around the 1900 dollar brand, with $ 1800 also offering support.
If the price recovers from this area, a quick increase in the direction of the $ 2,200 mark could be expected. On the other hand, a collapse would lead to a further correction in the direction of the sliding 200-day average, which would tend to be around $ 1, $ 1. The RSI has recently been oking around 50%threshold.
Tradingview
The 4-hour diagram
On the 4-hour chart, the price seems to try to break out of the range between $ 1,800 and $ 1,900. The resistance of $ 1900 is currently being tested again, and a bullish outbreak would pave the way for an increase towards values over $ 2000.
A further rejection could, however, initiate a declining movement in the direction of the level of support of $ 1800 and possibly even deeper. The RSI indicator tends over the 50 %brand in this time frame, which indicates that the bulls have control and a bullish outbreak is more likely.
Tradingview
.


Kommentare (0)