These are the critical levels for BTC in the immediate future (Bitcoin price analysis)
In the past two weeks, Bitcoin has retained its price movement within a range. However, there are several signs that indicate an upcoming outbreak. Technical analysis by EDRIS The daily chart The price has consolidated within the last 7 days in the daily time frame within a narrow range. This consolidation follows the downward rejection of the market at the level of resistance of $ 30,000 and the subsequent breakdown of the moving 50-day average of around $ 29,000. The expected declining price is currently with the support brand of $ 25,000. However, there is the possibility that the price will test the sliding 50-day average again before it decline ...

These are the critical levels for BTC in the immediate future (Bitcoin price analysis)
In the past two weeks, Bitcoin has retained its price movement within a range. However, there are several signs that indicate an upcoming outbreak.
technical analysis
of edris
The daily chart
The price has consolidated within a tight span in the last 7 days in the daily time frame. This consolidation follows the downward rejection of the market at the level of resistance of $ 30,000 and the subsequent breakdown of the sliding 50-day average of around $ 29,000.
The expected declining price is currently with the support brand of $ 25,000. However, there is the possibility that the price will test the sliding 50-day average again before continuing its decline towards $ 25,000.
The RSI also shows an upward trend and approaches the 50 %threshold, which indicates a possible withdrawal in the direction of the sliding 50-day average or maybe even a new test of the resistance level of $ 30,000 in the coming weeks.
It is worth noting that the latter scenario would probably destroy the former and that an interest-go out of the $ 30,000 mark would be more likely in this case.
Tradingview
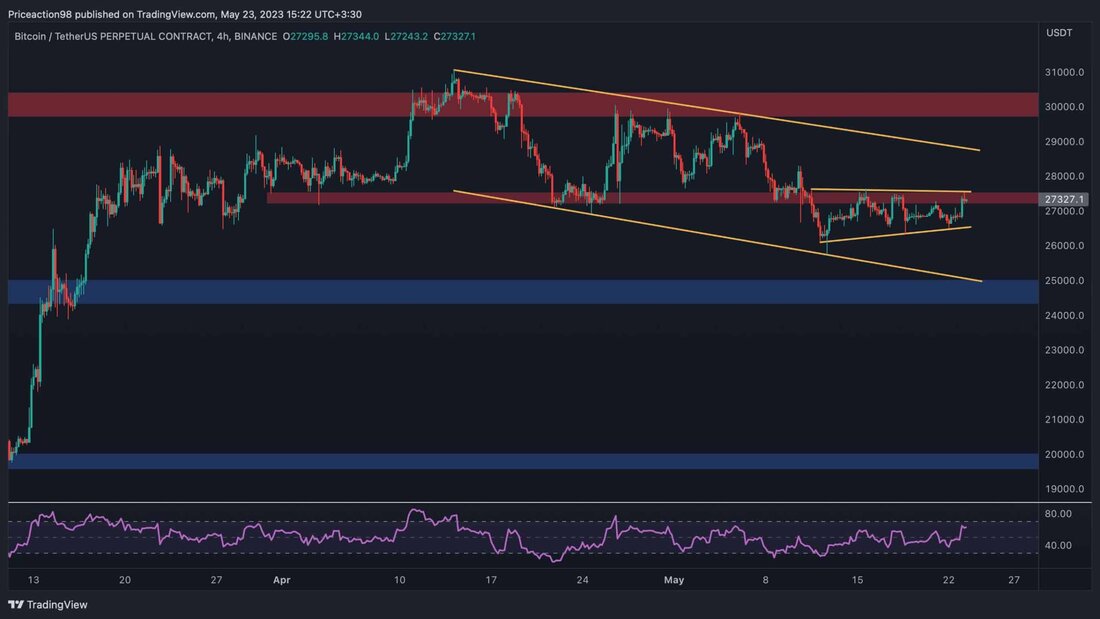
The 4-hour diagram
The 4-hour chart is an interesting situation. The price is currently going through a new test both the $ 27,500 mark and the upper limit of a small declining flag. If there is another rejection, there is a high probability of a decline in the direction of the lower limit of a larger channel and the level of support of $ 25,000.
on the contrary, an outbreak over this area would possibly lead to an advance from the larger channel, followed by a subsequent renewed test of the $ 30,000 mark in the near future.
In addition, the RSI indicates a bullish momentum with values over 50 % in this time frame, which further increases the likelihood that the bullish scenario will develop.
Tradingview
on-chain analysis
of Shayan
The following graphic illustrates the metric "Bitcoin Active Addresses", a sliding 30-day average, in addition to the BTC Prize since the Bärenmarkt 2017. This metric serves as an indicator of market demand. In the case of bull runs, the demand for Bitcoin increases, which leads to an increase in active addresses. Conversely, in phases of declining markets, the interest in the industry declines, which leads to a decline in the key figure of active addresses.
The latest behavior of Bitcoin is similar to the price development at the beginning of the bull market 2019. After a phase of consolidation, however, the indicator began an upward trend, at the same time with an interest bull -in medium -term price rally, which indicates a growing demand for Bitcoin. This phase can be described as an early phase of the 2019 bull market and precedes the main phase in which active addresses experienced a continued increase.
A similar pattern is currently emerging because the key figure continues to increase in parallel to the upward movement of Bitcoin. Based on the graphic, it can be concluded that Bitcoin may enter the early phase of his next bull run. Nevertheless, it is crucial to be aware of the market risks and volatility in these periods.
Cryptoquant
.

 Suche
Suche
 Mein Konto
