The calm before the storm? (Bitcoin price analysis)
The calm before the storm? (Bitcoin price analysis)
Bitcoin has got stuck in a span in the last few days after it was rejected by the resistance level of $ 30,000. There are various points for the market participants at short notice that they can look forward to.
technical analysis
from: Edris
The daily chart
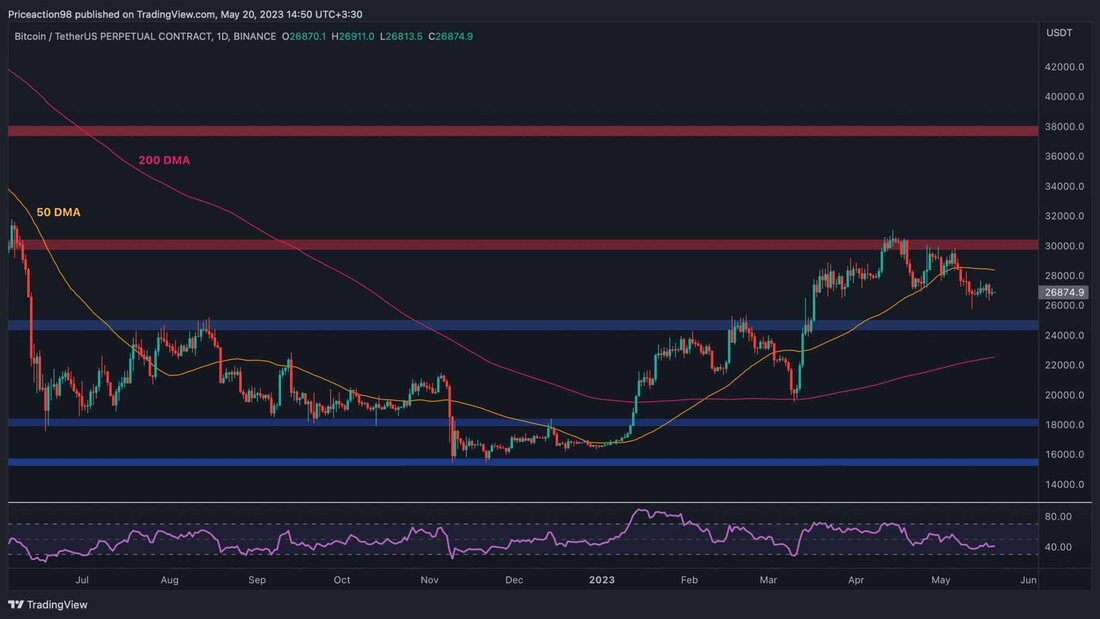
On the daily time frame, the price has consolidated in a very narrow area last week. This happened after the resistance level of $ 30,000 had rejected the market down. The sliding 50-day average was also broken around $ 29,000.
The most likely goal is currently $ 25,000. Nevertheless, the price could first test the sliding 50-day average again before sinking further towards this level.
The RSI also tends to the 50 %threshold, which indicates the current dominance of the seller.
Tradingview
The 4-hour diagram
A look at the 4-hour chart shows that the price in the past few days has had difficulty breaking out over $ 27,500 after several attempts led to a rejection.
From today's perspective,the lower border of the large flag pattern could soon be tested. If the price on the other hand finally climbs over the $ 27,500 mark, a recovery in the direction of the higher trend line of the pattern can be expected.
The RSI hardly offers any indications in this time frame, since it was relatively flat around the 50 percent mark.
Tradingview
on-chain analysis
position index of the Bitcoin miner
After a cruel bear market in 2022, the Bitcoin Prize has recovered since the beginning of the year. The main question now is whether the bear market is really over. Will there be further downward trends before the next cycle begins?
This diagram shows the position index of the miner, which represents the ratio of the entire drainage of the miners to the gliding one-year average of the entire drainage of the miners. High values are interpreted as an aggressive sale of the coins by miners.
A look at the graphic shows that this key figure has several peak values, which indicates that the miners use the latest price recovery to load large amounts of BTC, possibly to cover their costs.
This could indicate their pessimism regarding the short-term future of the BTC Prize and could also trigger a sale if things stay the same. Although the price has recovered significantly in recent months, investors should therefore be careful because some on-chain indicators signal negative signals.
Tradingview
.


Kommentare (0)