Cardanos Bullisches Momentum stops, is $ 0.36 imminent? (Ada price analysis)

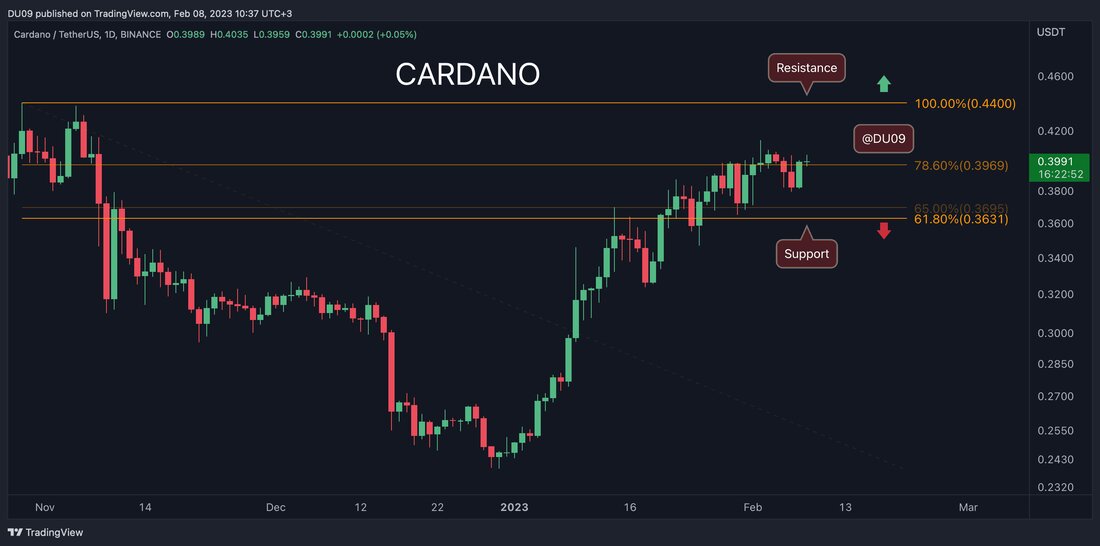
Cardano konnte sich nicht nach oben bewegen, und die Dynamik verlagert sich nun in Richtung Verkäufer. Wichtige Unterstützungsniveaus: 0,36 $, 0,32 $ Wichtige Widerstandsniveaus: 0,40 $, 0,44 $ Nach mehreren gescheiterten Versuchen am 40-Cent-Widerstand stehen die Bullen kurz davor, die Kontrolle über die Preisbewegung zu verlieren. Sollte die Kryptowährung fallen, dann wird die Schlüsselunterstützung bei 36 Cent zu finden sein. Da die Indikatoren rückläufig werden, könnte Cardano in den kommenden Tagen eine Korrektur einleiten, die die Käufer unter Druck setzen wird. Diagramm von TradingView Handelsvolumen: Das Volumen macht niedrigere Höhen, was signalisiert, dass die Käufer erschöpft sind. RSI: Der tägliche …
Cardano could not move upwards and the dynamics now shift towards the seller. Important support levels: $ 0.36, $ 0.32 Important resistance level: $ 0.40, $ 0.44 After several failed attempts on the 40-cent resistance, the bulls are about to lose control of the price movement. If the cryptocurrency falls, the key support will be found at 36 cents. Since the indicators are declining, Cardano could initiate a correction in the coming days that will put the buyers under pressure. Diagram of TradingView trade volume: The volume makes lower heights, which signals that buyers are exhausted. RSI: The daily ... (Symbolbild/KNAT)

Cardanos Bullisches Momentum stops, is $ 0.36 imminent? (Ada price analysis)

Cardano could not move upwards, and the dynamics now shifts towards the seller.

Important support levels: $ 0.36, $ 0.32

Important resistance level: $ 0.40, $ 0.44

After several failed attempts at the 40-cent resistance, the bulls are about to lose control of the price movement. If the cryptocurrency falls, the key support will be found at 36 cents. Since the indicators decline, Cardano could initiate a correction in the coming days that will put the buyers under pressure.

Adausdt_2023-08_09-37-08 Diagram of Tradingview

trading volume: The volume makes lower heights, which signals that buyers are exhausted.

rsi : The daily RSI falls towards 50 points, and the trend is negative with lower lows.

macd : The daily MacD declined last weekend and the histogram forms lower lows. This shows that sellers have the upper hand.

Adausdt_2023-08_09-37-39 Diagram of Tradingview

bias

The tendency for ada is declining.

Short-term forecast for the ADA Prize

Cardano seems to have found a local tip at 40 cents, and a correction from this point appears likely. Bears could control the price movement until the first level of support at 36 cents where buyers could return to reverse the downward trend.

.