BTC is looking for direction while the FOMC session is imminent (Bitcoin price analysis)
BTC is looking for direction while the FOMC session is imminent (Bitcoin price analysis)
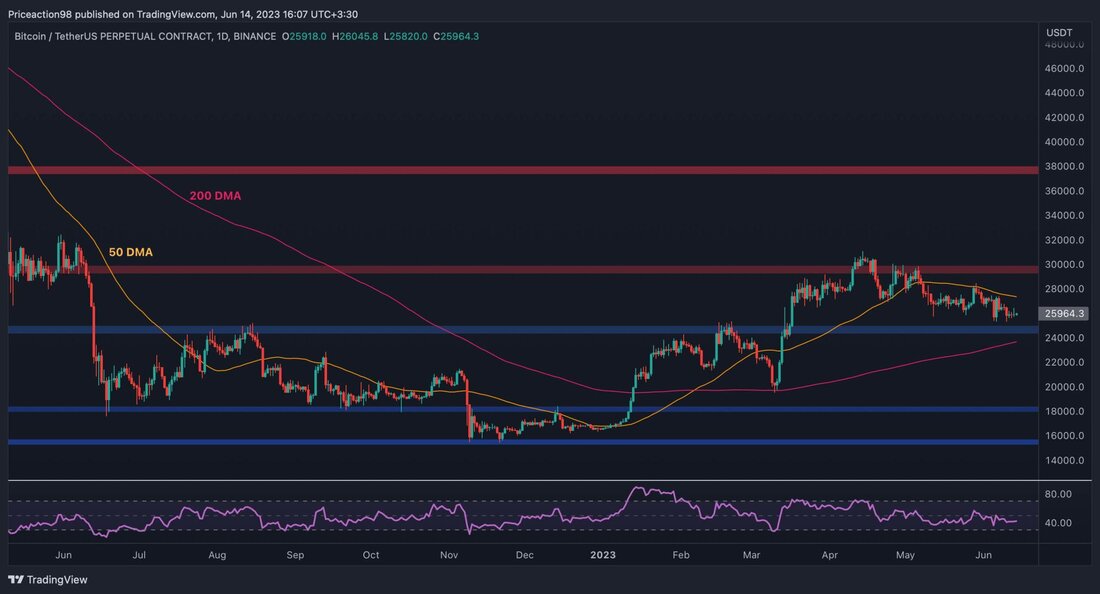
The Bitcoin price is still in a consolidation phase below the resistance brand of $ 30,000 after trying to break through it a few weeks ago. However, several levels of support nearby have the potential to act as catalysts for a possible upswing.
Technical analysis of the Bitcoin Prize
from: edris
The daily chart:
on the 4-hour chart, the price is still caught within the large descending channel and is in a slow downward trend that leads to lower highs and lows. The short-term resistance of $ 26,000 is currently preventing the price towards the upper border of the canal. Should the price come down again, a new test of the support level of $ 25,000 would be imminent.
The RSI indicator also fluctuates around the 50 percent mark and only offers limited information about whether the dynamics are bullish or bear, since buyers and sellers fight in a key area.
Tradingview
The 4-hour diagram:
In the 4-hour time frame, the Bitcoin price remains within a significantly descending channel and shows a gradual decline, which is characterized by lower highs and lows.
The BTC Prize currently comes up with resistance near the $ 26,000 mark, which hinders its upward movement towards the upper border of the canal. If the price is rejected again, it will probably reach the level of support of $ 25,000 again. In addition, the RSI indicator, which is around 50 %brand, only offers limited indications of the dynamics, since buyers and sellers compete at a critical point.
Tradingview
on-chain analysis
by: edris
Bitcoin stock exchange reserve
The Bitcoin Prize went through a correction phase after he had come across resistance in the $ 30,000 mark. This correction could be due to the fact that investors used the increase in $ 17,000 in order to sell their coins at a higher price. However, a more precise consideration of the foreign exchange reserves shows a change in market behavior.
The diagram shows a steady increase in foreign exchange reserves during the price rally, which indicates profit. Nevertheless, after the latest correction, the market participants have to be accumulated again, which has led to a rapid decline in the foreign exchange reserve index in recent weeks.
If this trend continues, the decline in the offer and the potential increase in demand could contribute to an upward trend in the coming weeks. For a more comprehensive view, however, it is also important to take into account the analysis of the perpetual futures market.
Cryptoquant
.


Kommentare (0)