BTC falls towards $ 27,000 due to network overload, are $ 25,000 next? (Bitcoin price analysis)

BTC falls towards $ 27,000 due to network overload, are $ 25,000 next? (Bitcoin price analysis)
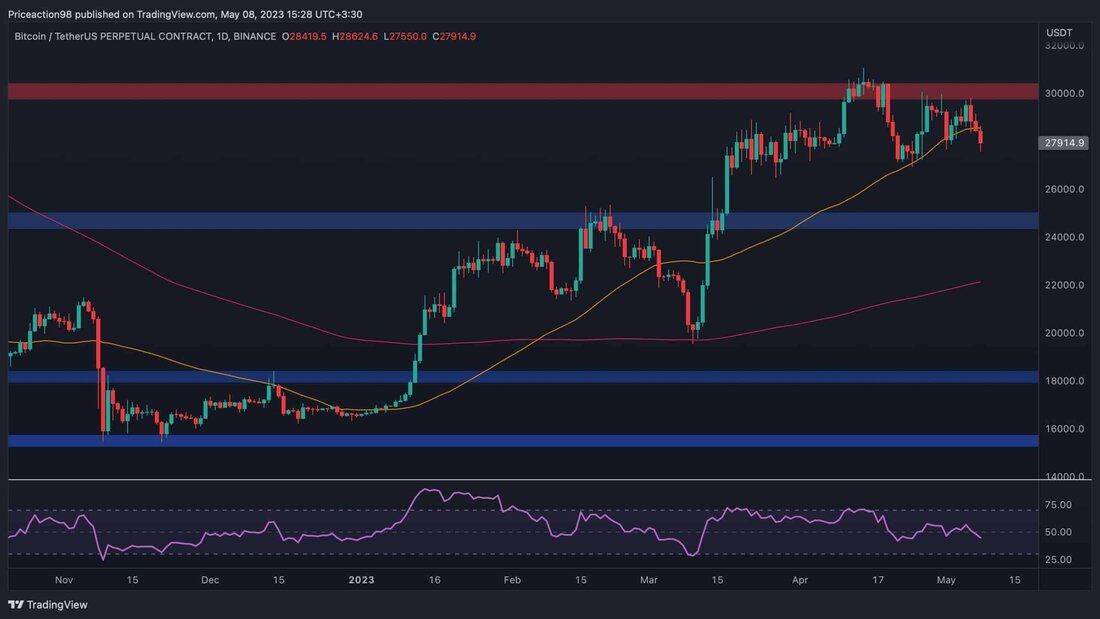
The price of Bitcoin has been tending up since the beginning of 2023. However, he recently showed signs of a reversal after the resistance level of $ 30,000 was clearly rejected.
technical analysis
from: Edris
the daily -type
The price has consolidated since he failed to break the resistance brand of $ 30,000. The sliding 50-day average offered support, but is currently broken up around $ 28,000 marks.
In the event of a valid bear outbreak, the level of support of $ 25,000 would be the next probable goal, followed by the sliding 200-day average, which is around $ 22,000. The RSI has also recently fallen below the threshold of 50 %, which indicates a possible short -term decline, since the momentum shifts down.
The 4-hour diagram
on the 4-hour chart is obvious that the price has recovered at a close range between the level of $ 30,000 and $ 28,000 and is currently testing the latter. If there is a collapse, a rapid crash in the direction of the $ 25,000 zone would be expected at short notice.
Nevertheless, the RSI approaches the oversized area, which increases the likelihood that the price of the $ 28,000 mark will recover and again in the direction of the $ 30,000 resistance. All in all, the declining scenario appears more likely from a classic price-action view both in the daily and 4-hour time frame.
Tradingview
onchain analysis
of Shayan
Due to the increase in Bitcoin transactions on Sunday, the fees paid to the miners have increased considerably. This pattern is unusual for bear markets, but often occurs at Bullenmarkt highs.
The increasing use of the troot update, which enables the inclusion of NFTS and the BRC-20 Token to the Bitcoin blockchain, can be related to the increase in transaction fees. While this can be a disadvantage for routine transactions, it is an advantage for the mining result.
In addition, this shift has led to changes in other on-chain metrics, such as: B. a significant increase in the number of active addresses and transactions. This could be seen as a positive sign and marks the beginning of a bull market.
Cryptoquant
.
